For this year’s National Day of Civic Hacking, 127 New Yorkers came together for the City’s first Mobility for All Abilities hackathon co-hosted by BetaNYC and MakerSpace NYC.
Our goal was to bridge existing mobility equity efforts to diverse talent and resources that could help advance them. Prior to the event, our team assigned participants to challenge teams based on self-identified skill sets, experience and interest. To this end, they helped advance eight community-driven efforts to make NYC a place where all people have the ability to move around free from physical, social or economic obstruction.
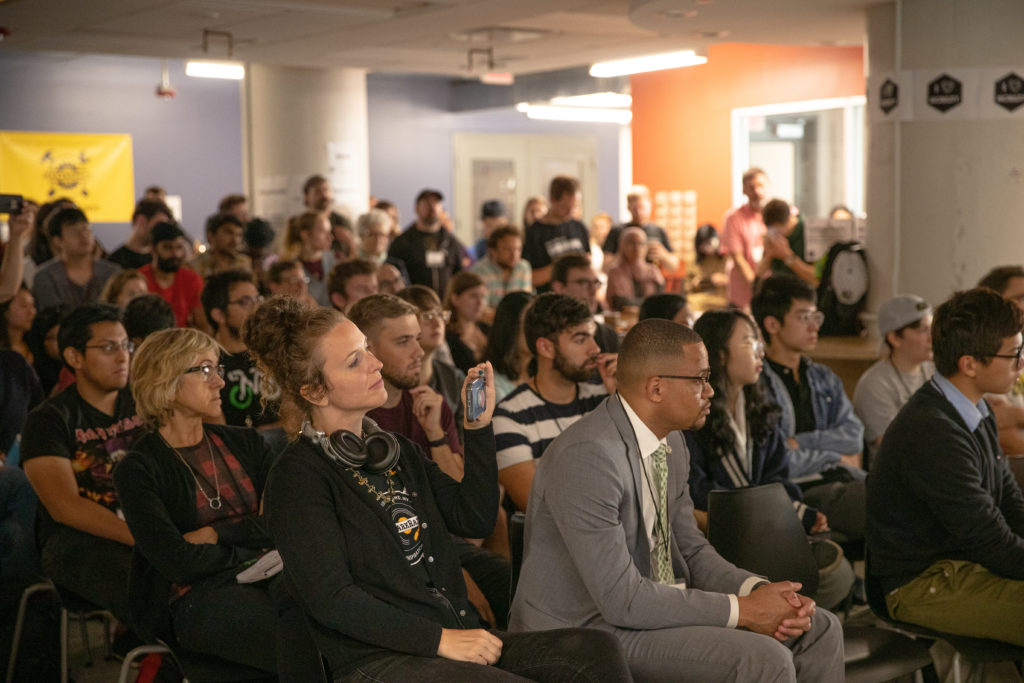
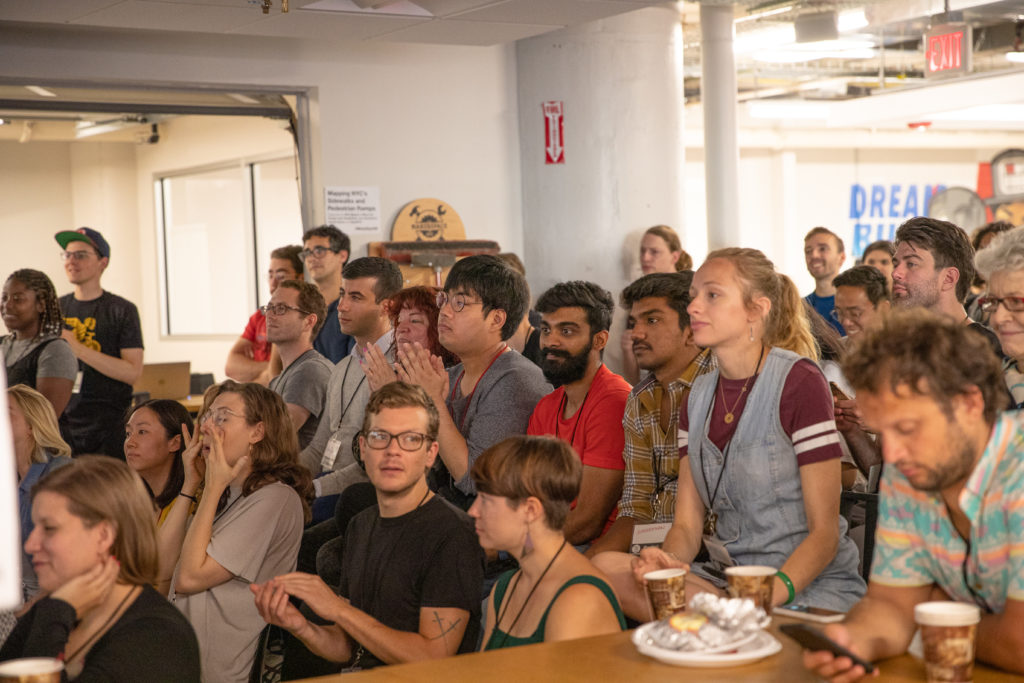
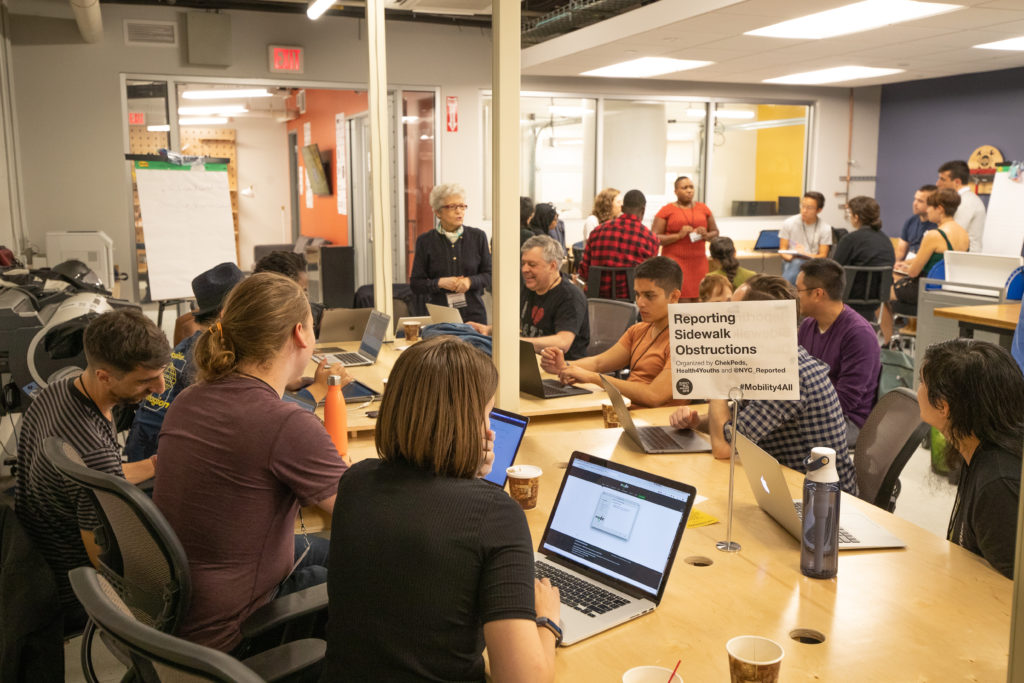
15 organizers worked with 90 participants for 4.5 hours on 8 projects to improve mobility equity in NYC. It was impressive to see how quickly participants aligned their skills to address the challenges. Everyone arrived focused and ready to build, learn and collaborate. The energy at MakerSpace was like a buzzing co-working space meets chill coffeeshop, on steroids. Attendees included disability and mobility advocates, civic technologists, user experience (UX) designers, developers, data statisticians, analysts, safe streets supporters, students, tech start-ups, civil servants, City Agencies, Mayor’s Offices, and Elected officials.
Rachel, who participated in the Reliable Access to Subways challenge, remarked on the value of these different worlds merging, which for me, validates the purpose of our work at BetaNYC. The tools that will transform society and life as we know it in NYC live beyond the screen.
“I learned a lot from Dustin and TransitCenter about what would actually be helpful for their advocacy. As technologists, I think we sometimes have to resist the urge to make another consumer-facing app.”
Rachel Connolly, Program Coordinator, Women in Technology and Entrepreneurship in New York
We were lucky to have Council Member Brad Lander kick off the day with remarks that affirm the value of civic technologists and designers partnering with community organizers and advocates.

“There’s lots of work, but we would not be at the starting gate if it weren’t for the kind of work that you are going to be doing here today— that partnership that recognizes a problem, that thinks creatively about the data that’s out there to solve them in ways that people haven’t thought about it before—that’s anchored in partnership between people who are on the frontlines of facing a problem and the folks trying to solve it.”
NYC Council Member Brad Lander, District 39
As part of Council Member Lander’s introduction, he spoke about the tragic events that led up to the creation of How’s My Driving and Reckless Driver Accountability Bill he has proposed. On 5 March 2018, a horrific crash took the life of two children and led Brian Howald, who was in the audience, to create How’s My Driving NYC. This tool lets the public look up camera or parking related violations based on NYC open data.
Note: If you are looking to make NYC’s streets safer, please support the Reckless Driver Accountability Bill by signing this petition or read more about it via StreetsBlog. Also, check out How’s My Driving NYC or fork it for your city.
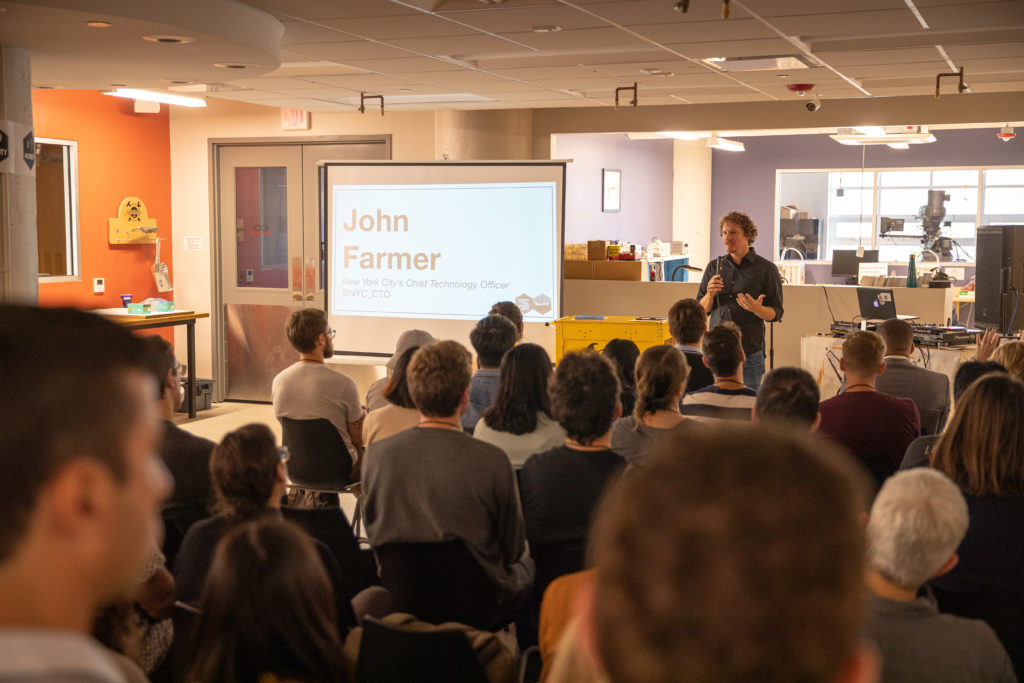
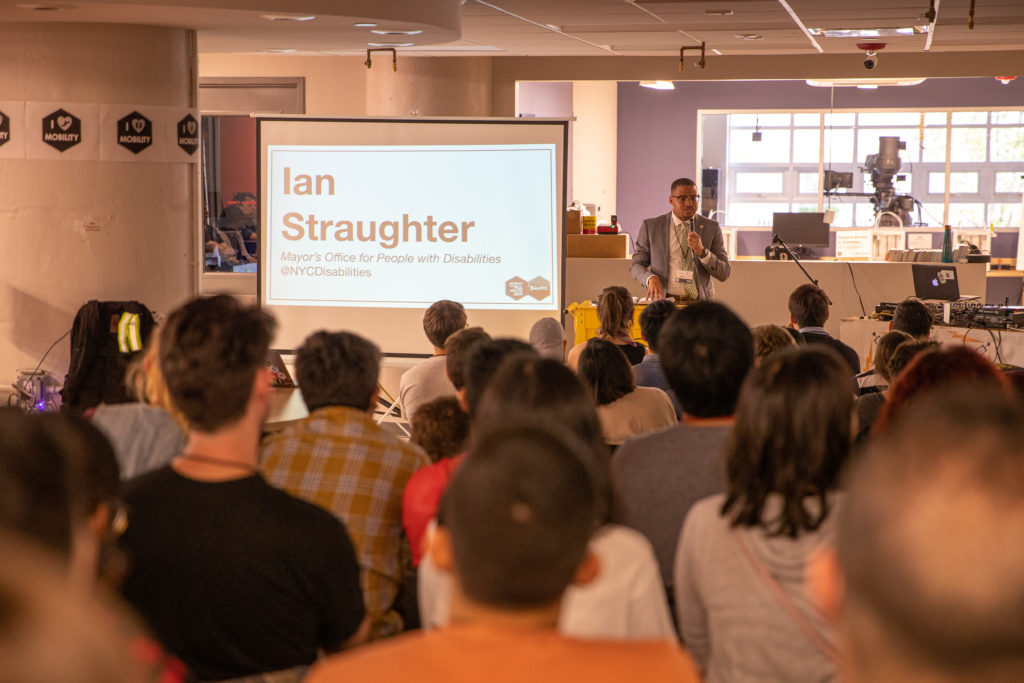
We also got to hear from NYC Chief Technology Officer John Paul Farmer, Zachary Feder of the Mayor’s Office of Data Analytics, Ian Straughter of the Mayor’s Office for People with Disabilities, Daniel Alam on behalf of the Manhattan Borough President, and Nathan Sherfinski on behalf of the Brooklyn Borough President. We are so grateful to have partners in these offices and elected officials, and that each recognizes the value of bridging civic tech communities with their work.
MakerPark Radio, a non-profit community streaming radio station based in Staten Island, graciously documented it all with us. You can listen to what everyone had to say here.

Shout out to our friends, allies, and colleagues at the College of Staten Island, St. George for also hosting a day-long Mobility for All Hackathon. It looks like you had a successful event!
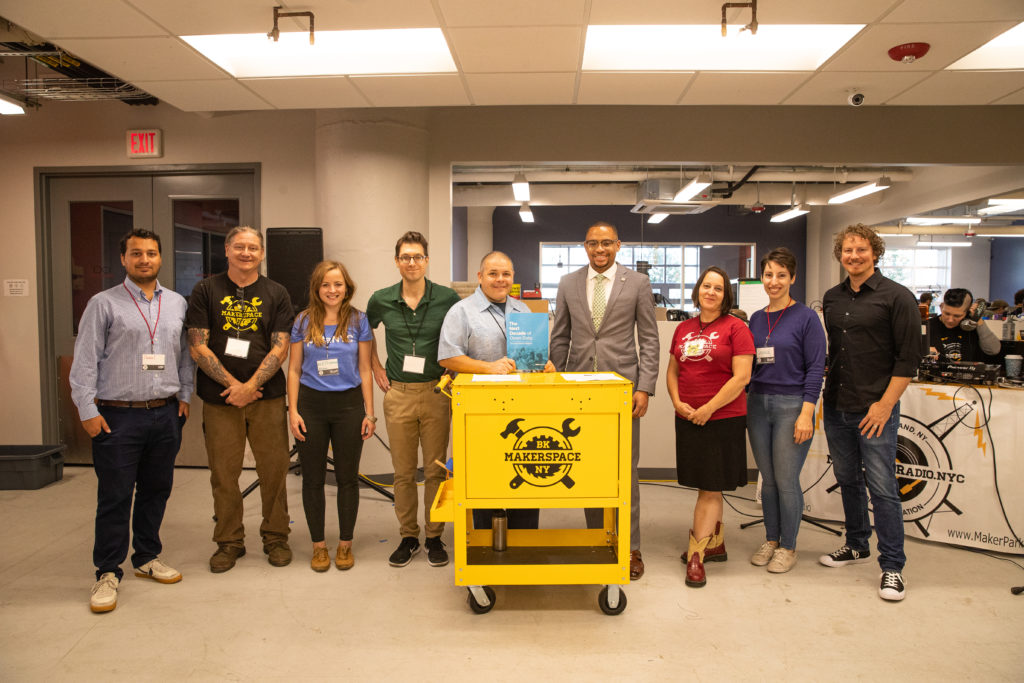
Thank you for a great event.
Thank you community organizers who brought local issues and expertise to the table. Thank you participants who brought talent, skill, and open minds. Thank you speakers who emphasized the importance of everyone’s work and shared insight. Thank you sponsors who helped us cover costs. Thank you volunteers who ran the show.
Thank you Alfred P. Sloan Foundation, Esri, Fund for the City of New York, MakerSpace NYC, TransitCenter, PeopleForBikes, Carbon Black, CDW, Coord & Variety Coffee, for your support.
Check out the project reports, some of our favorite tweets, event photos, and livestream footage (including welcoming remarks, team presentations, and interviews with organizers).
If you would like to follow-up about anything, contact me, kate[at]beta[dot]nyc.
– Kate Nicholson @katehnicholson

Project Reports
Click to view a project.
Alternative and Inclusive Futures for Mobility
Organized by Crystal Penalosa
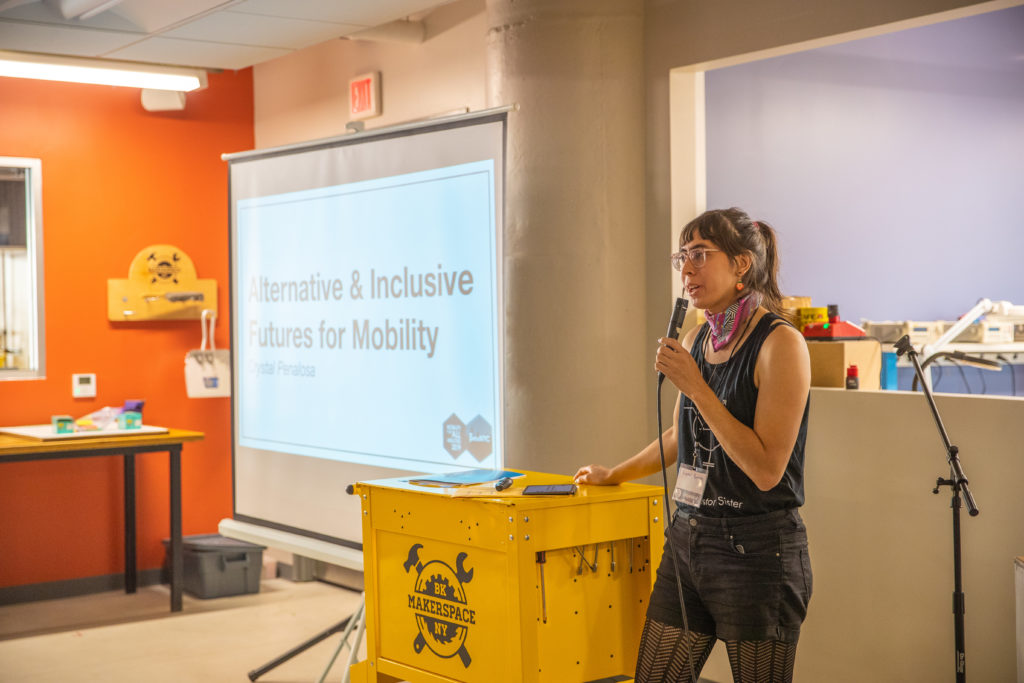
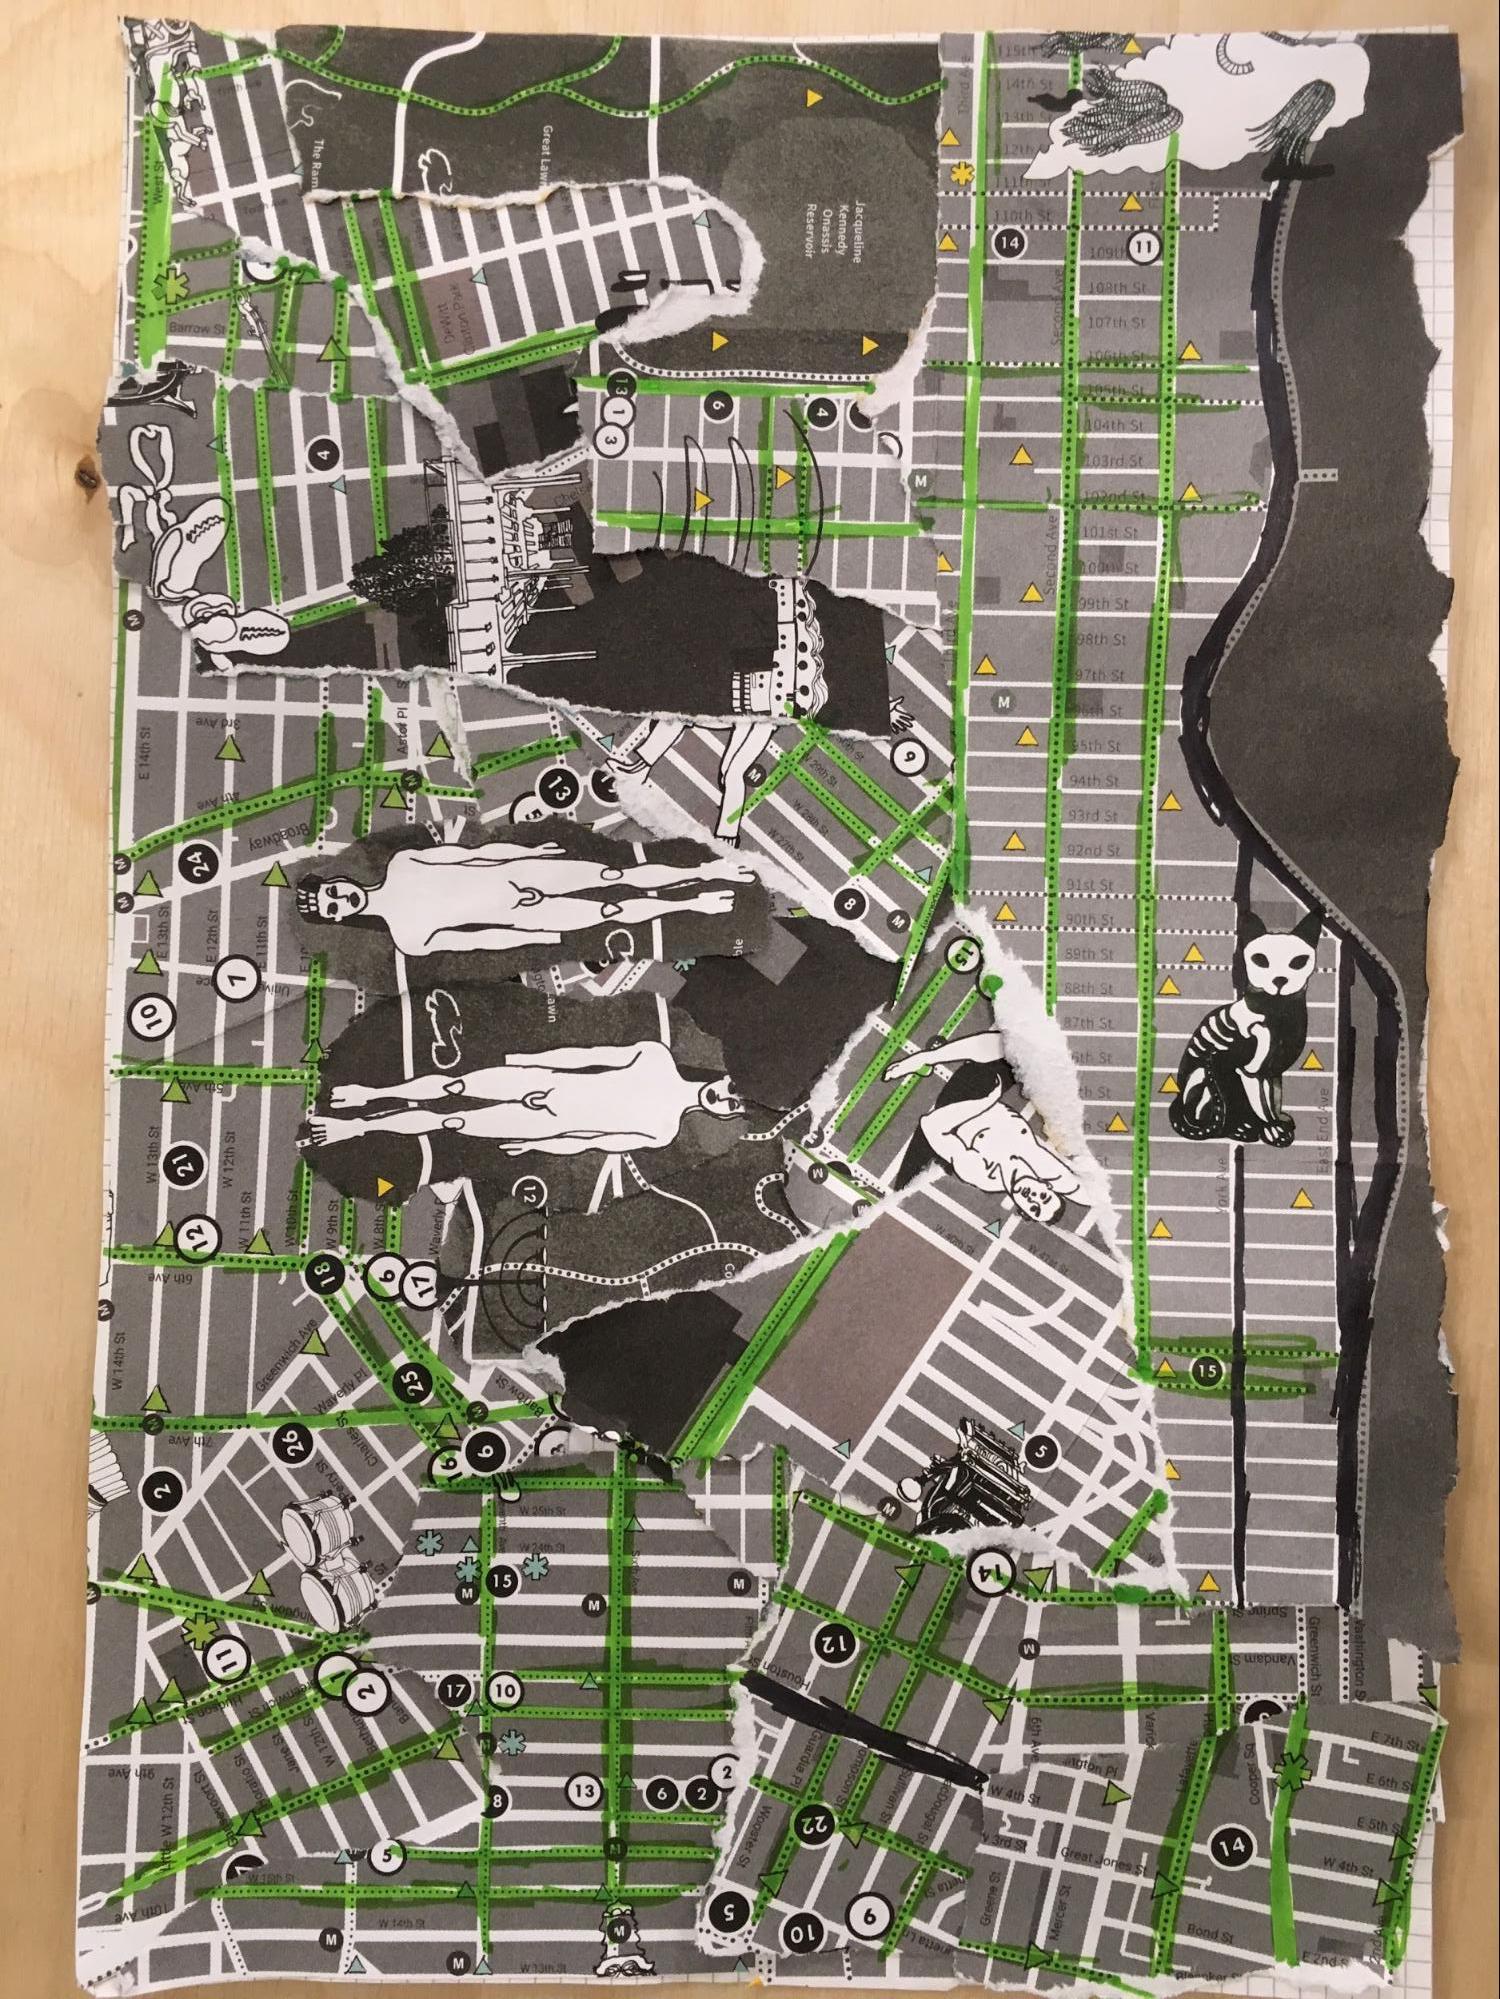
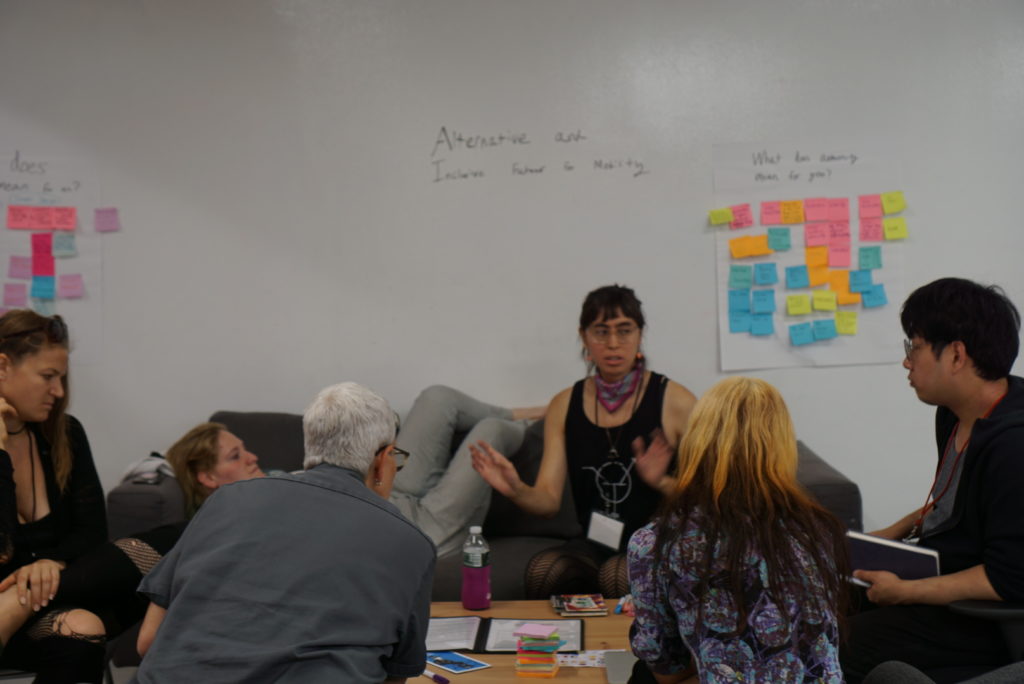
Amidst the hacking, Crystal led a kind of “self” hacking in their session. With current experiences on public transportation being exclusive, particularly for people with disabilities and LGBTQ people, this challenge set out to give the group a set of tools to imagine a different, more inclusive future. Crystal held an engaging dialogue and led the group through a series of activities exploring what it could feel like to freely move throughout the city. They surfaced insights into what it means to feel safe and authentic and produced collages expressing the learnings. Unique to most hackathon experiences we have been apart of, Crystal also offered breathwork sessions at the top of every hour. They took place outside in a courtyard of Brooklyn Army Terminal, where Crystal led the group through an active meditation of intentional breathing, letting go of the day and plugging into different levels of being.
In their own words:
“It was very refreshing to have a session that was discussion based and gave people the chance to talk about their feelings about mobility as it relates to safety and what it means to be yourself in your daily routines. The collages they designed and the letters they wrote to their future-selves work as time capsules that express vulnerabilities and desires about the future. While a small contribution, I hope the seeds they planted open up new ways of thinking and seeing the world.”
– Crystal Penalosa, Challenge Organizer
Project Objectives:
- Collaboratively share tools for self-care when accessing different mobility options in the city
- Collaboratively share tools for imagining and advocating for alternative futures
- Collaboratively imagine what a more inclusive future looks like
Project Stats and Outcomes:
- 6 participants
- 4.5 hours
- Presentation File
- Presentation Video
- Collages:
Contact: Get in touch with Crystal at https://crystalpenalosa.info/
Bicycle Networks x Redlined Districts
Organized by Courtney Williams, @BrownBikeGirl
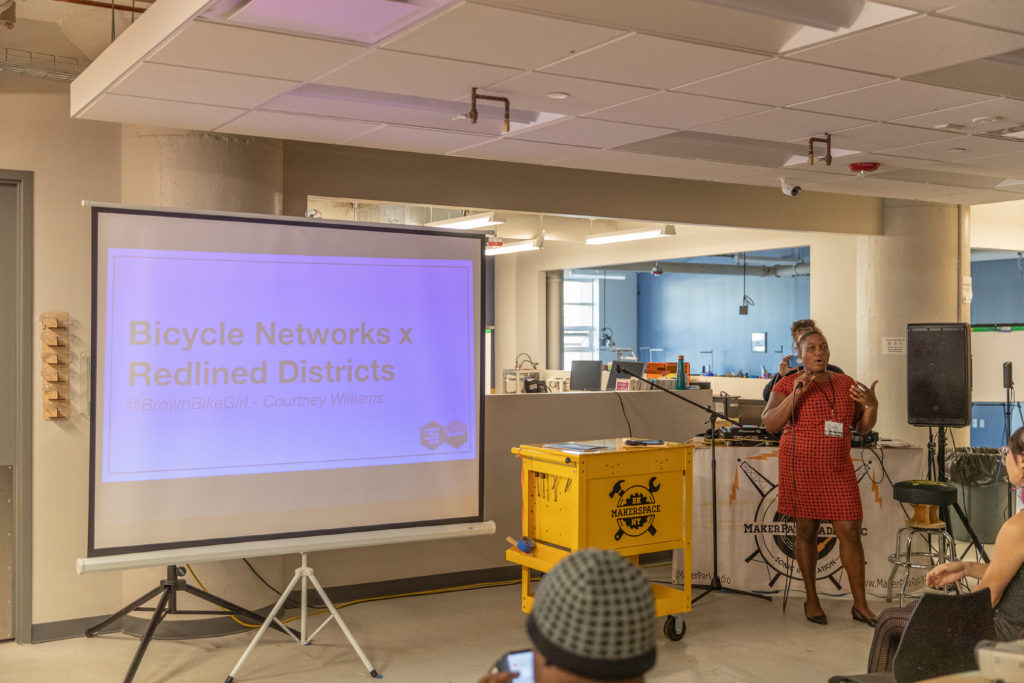
Under federal instruction in the early 1930’s, financial institutions use race and geography to refused or limited loans, mortgages, and insurances — this disproportionately affected New York City’s black and immigrant communities. This legacy of redlining still impacts New York City’s services, infrastructure, housing, and commerce.
Courtney’s team wanted to understand how such a legacy affects the implementation of and types of bicycle infrastructure across neighborhoods. They asked, “is redlining’s restrictive legacy still influential in distribution of modern infrastructure types?”
Using Esri mapping software, participants selected, grouped, and calculated the length of existing bike lanes and roads by HOLC districts (QGIS, python scripting) using the following datasets: HOLC Historic Lending Maps: Green, Blue, Yellow, Red districts shapefile, Bike lanes shapefile, ACS 2017 census tract demographic and income data.
Project Stats and Outcomes:
- 4.5 hours
- 11 Participants
- Presentation File
- Presentation Video
- Research Insights:
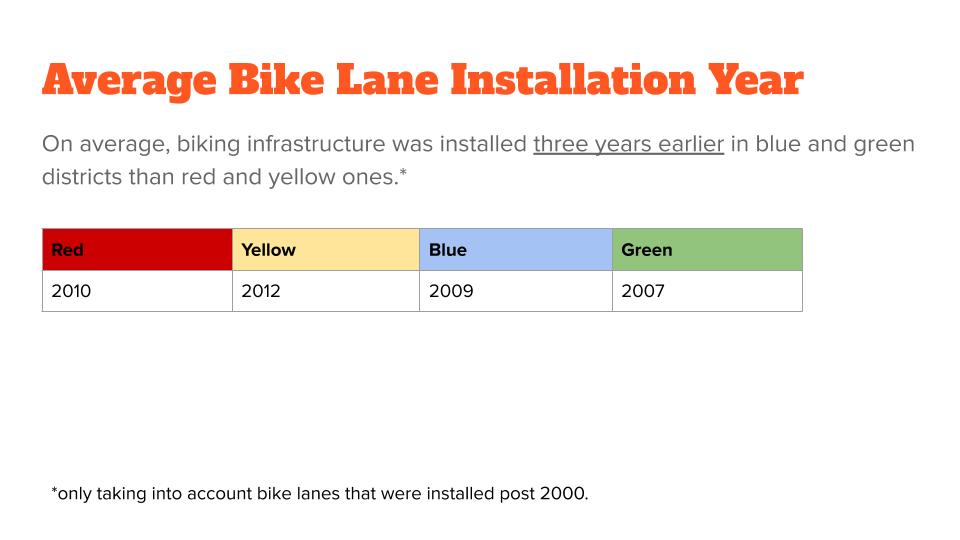
- Bike lanes were installed earlier in neighborhoods with a Green grade
- Bike lanes are more likely to be protected in Blue and Green grade areas than in red or yellow
- More bike lanes per road in red lined districts
- Map and Analysis
Next Steps: Courtney is interested in conducting similar analyses in other major cities. If you are interested or have friends or resources she should connect with, let her know.
Contact: Get in touch with Courtney on Twitter @BrownBikeGirl or https://thebrownbikegirl.com/.
Bicycle Mapathon
Organized by NYC Department of Transportation & People for Bikes
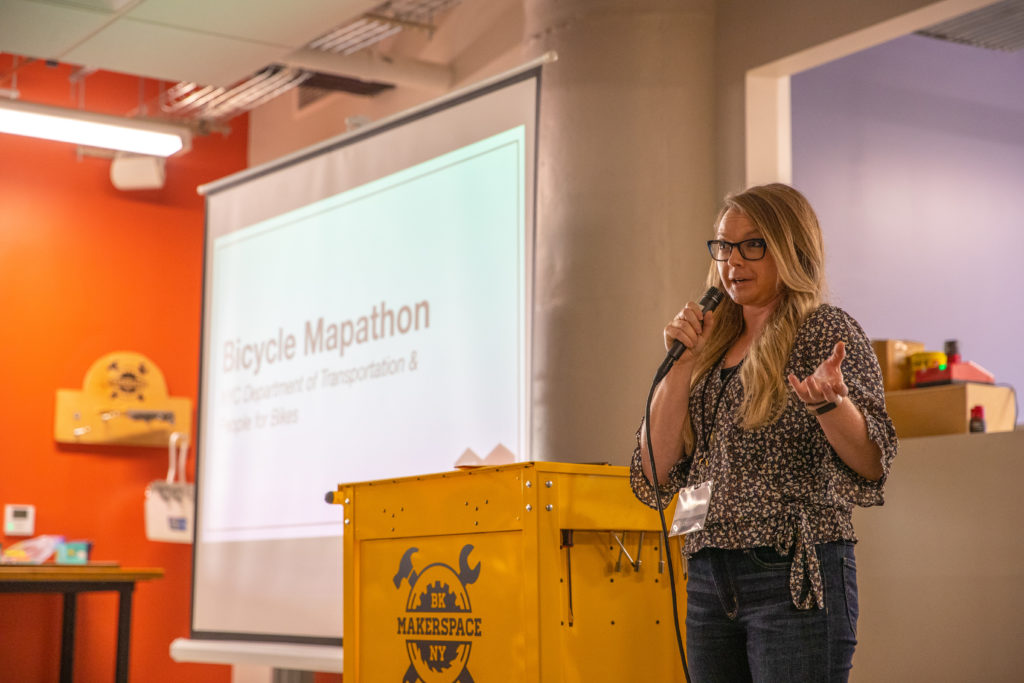
This challenge was organized by NYC Department of Transportation, PeopleForBikes, BetaNYC and ESRI, to improve the quality of NYC bicycle-related data in OpenStreetMap (OSM). Their objective was to improve the quality of bicycle data on OSM. With better quality data, tools and services that utilize OSM will have greater accuracy and thus be more useful for current and future bicycle riders and advocates. One such tool is PeopleforBikes’ Bicycle Network Analysis.
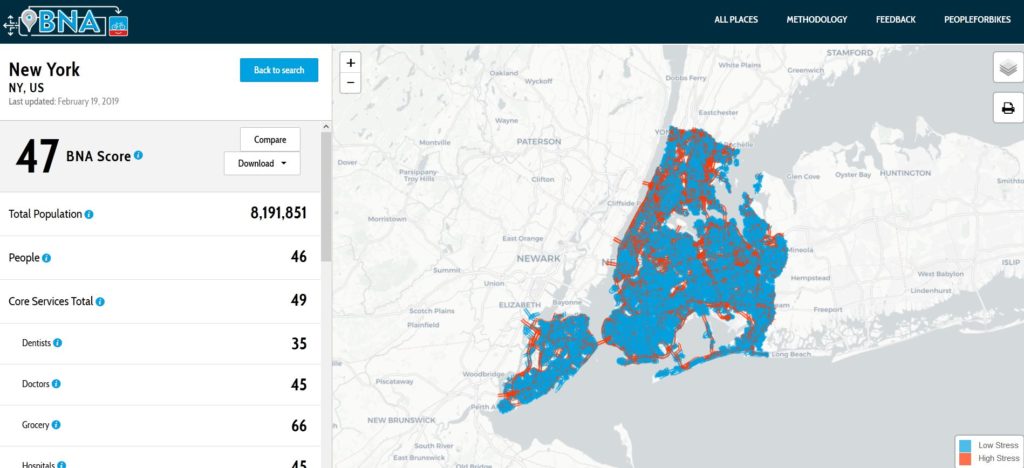
Each year, DOT makes regular updates to their network of bicycle facilities in ArcGIS and shares that information through their website. This year, DOT partnered with People for Bikes and BetaNYC to host a map-a-thon that will make their data more accessible on the world’s most widely-used mapping platform, Open Street Map. OSM information feeds into NYC’s Bike Network Analysis (BNA) score, which helps communities measure the quality of their low-stress bike network, and serves as the base information for many routing applications that pull bicycle facility information. Improving the accuracy of the bike data in OSM will help improve NYC’s BNA score, while also increasing the accuracy of routing for cyclists.
Facilitators from DOT and PFB set out a few goals for their group, many of whom were first-time mappers.
- Learn how to map bicycle infrastructure and related info in OSM
- Understand NYC DOT bicycle data and infrastructure classifications
- Become familiar with measures of bicycle infrastructure safety, comfort and connectivity
- Find your inner City Planner — learn to interpret infrastructure around you
Project Stats and Outcomes:
- 4.5 hours
- 20 Participants
- Presentation File
- Presentation Video
- Participants updated 25 of 59 NYC Community Board Districts (see the Bike Network Analysis Map)
- 20 new active OSM users
“Thanks for being part of a great day at the Mobility for All Abilities Hackathon! We covered a lot of ground and you established yourselves as new authorities on NYC’s bicycle data.”
– PeopleForBikes
Follow up from PeopleForBikes:
- Stay up to date with new bicycle projects fro NYC DOT: < https://www1.nyc.gov/html/dot/html/contact/email_signup.shtml >
- Help us complete the update of OSM with bike infrastructure for all Community Board districts. Alanna kindly created a spreadsheet documenting our progress towards reviewing all of the Community Board districts. Once we’ve covered all of the districts, I will update the scores for NYC and all five boroughs on the Bicycle Network Analysis website.
- Add additional street information to OSM, such as speed limits and number of travel lanes.
- Join BetaNYC to participate in future hackathon and mapathon events! They will be building out an OSM training curriculum and could benefit from your participation and expertise.
- Connect with bike, ped, and transit advocacy groups in the city & state: Bike New York, Transportation Alternatives, New York Bicycling Coalition
- Use the BNA maps to identify high-stress streets for bicyclists in your Community Board district and advocate for improving those streets at an upcoming Community Board meeting.
- Get out and ride a bike! Citi Bike, Five Borough Bicycle Club, New York Cycle Club, Staten Island Bicycling Association, and WE Bike NYC can help you get started or find riding buddies.
- If anyone is interested in running the BNA themselves, the source code lives here and a beta version of a more user-friendly Python translation of that code lives here. Email me if you have questions about how to do this (some coding experience is required).
- Stay up to date with new bicycle projects from NYC DOT: https://www1.nyc.gov/html/dot/html/contact/email_signup.shtml
- Join Geo NYC to connect with other people doing great work with spatial data.
Thank you to everyone who helped finish mapping New York City’s bicycle infrastructure data in the remaining Community Board districts following the Mobility for All Abilities Hackathon. The Bicycle Network Analysis has been updated with the following results:
October 23, 2019 update from Rebecca Davies:
* Brooklyn gained 0.5 points for a score of 58, which places it first among all regions in the BNA with more than 500,000 people, just beating out #2 San Francisco.
* The Bronx gained 4 points for a score of 33.
* Manhattan lost 1 point, falling to a score of 45. This could have been from our edits but most likely from other changes to OSM since we last updated the BNA.
* Queens gained 3 points for a score of 49.
* Staten Island gained 3 points for a score of 33.
* New York City as a whole gained 1 point, for a score of 48.
While the gains may sound small, they are meaningful for a region as vast and heavily traveled as New York City. Also, the ultimate goal of updating the map is accuracy, regardless of the score impact.
We’d love to keep up the momentum, so please consider taking some of the following steps to improve the data in OSM and support the development of a great bicycle network throughout New York City!
Add speed limit data in OSM for streets in your Community Board district.
Attend your next Community Board meeting to express your support for more and better bike infrastructure.
Join BetaNYC’s Meetup group and stay tuned for future events.
Sign up for the PeopleForBikes advocacy army. We will alert you when there are bike-related policies proposed for your region so that you can take action. When the NYC Bicycle Routes data is updated, we will ask for your help adding newly built infrastructure into OSM.
Thank you for supporting this challenge:
Mapping NYC’s Sidewalks and Crosswalks
Organized by NYC Mayor’s Office for People with Disabilities, Eric Brelsford, Daniel Solow, and BetaNYC
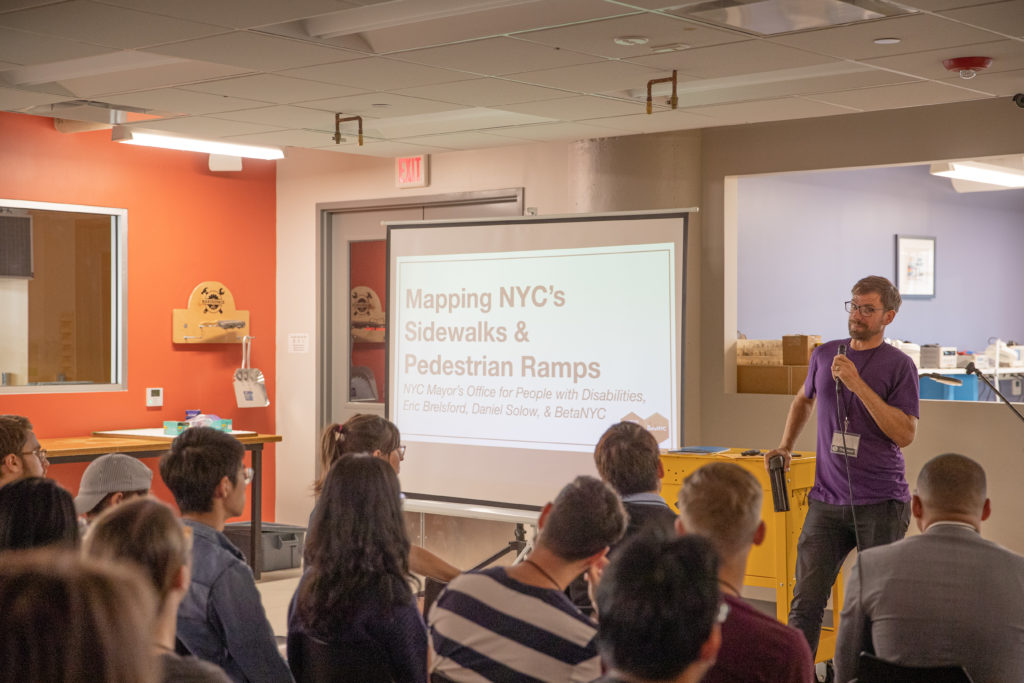
In partnership with the Mayor’s Office of People with Disabilities, organizers set out to teach participants of this challenge to improve Open Street Maps’ sidewalk data. This challenge asked participants to add or edit data of footways, sidewalks, marked/unmarked crossings, crossing islands, and curbs, and compare data from NYC DOT’s pedestrian ramp survey data to OSM, to ultimately increase NYC’s sidewalk and crossing data in OSM
This challenge used Open Sidewalks protocols, NYC Department of Transportation Pedestrian Ramp Program Surveys to document sidewalks, footpaths, and crossings in the top community board where New Yorkers with ambulatory disabilities need sidewalk data the most: Bronx CB9. Once insights and methodology are established, mappers will focus on other community districts where there are significant numbers of residents with ambulatory disabilities and need accurate sidewalk data — Brooklyn CB 13, Manhattan CB 12, Staten Island CB 1, Queens CB 12
What participants did:
- Learned how to use OpenStreetMap
- Each person picked part of the task map, a section of CB9
- Individually, we used the aerial view to identify sidewalks and crosswalks (marked and unmarked)
- Used the line tool to mark sidewalks, crosswalks, and curb cuts (where applicable)
- After today, our group leaders will validate the work and make missed connections
- Discussed findings and limitations of OpenStreetMap, the task management system, and this challenge
Resources:
- Guide to Mapping Sidewalks and Crosswalks in Open StreetMap
Copyright: Teaching Materials – Creative Commons 4.0 Intl – Attribution
Attribution: Eric Brelsford, Daniel Solow, BetaNYC - Check out the task manager to work on more areas (find the tasks under the Mobility for All Abilities campaign).
Project Stats and Outcomes:
- 4.5 hours
- 17 participants
- 17 new Open Street Map sidewalk mappers
- 115 miles of sidewalks mapped on OSM in Bronx CB9
- 12 miles of crosswalks mapped on OSM in Bronx CB9
- Presentation File
- Presentation Video


Thank you for supporting this challenge:

Contact: Join the OSM NYC Slack Channel to follow this dialogue with Eric, Daniel and BetaNYC.
Managing Curbside Chaos
Organized by OpenPlans and Coord
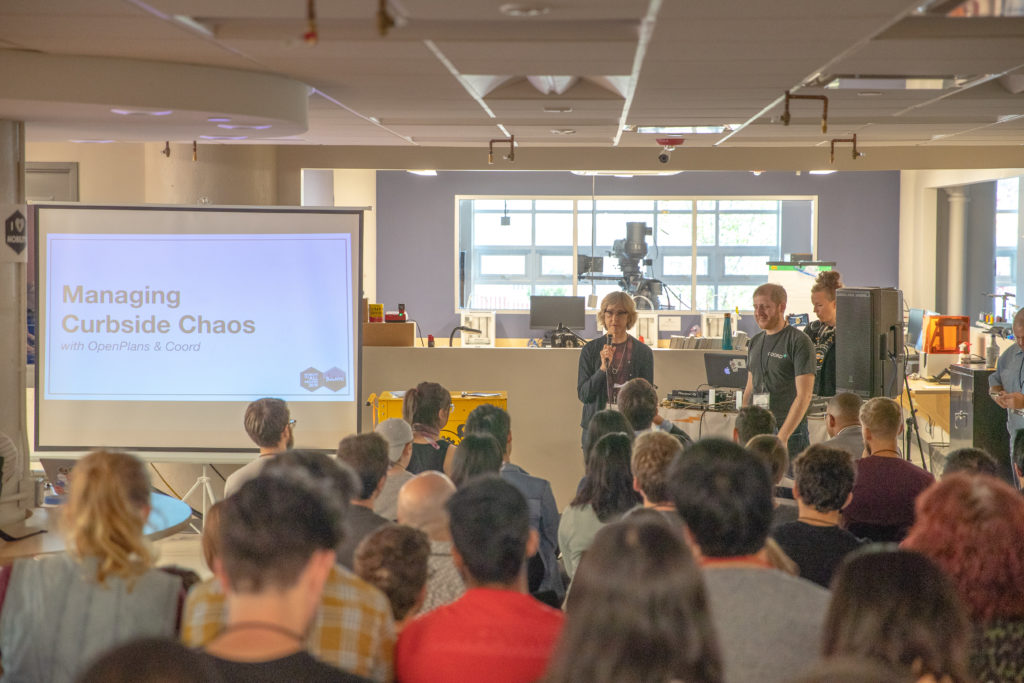
Janet Liff (Open Plans) and Jacob Baskin (Coord) got together to improve how NYC manages and regulates its curbside using data-driven evidence. They asked their team to identify where vehicles violate parking rules and regulations the most, so that they could point out weaknesses in curbside governance to decision-makers. They discovered a number of datasets on the NYC Open Data Platform containing various parking violation information— from violations officially issued, to 311 complaints reported by citizens. Their work began with downloading, cleaning and geo-coding the datasets. From there, they created a unified map of parking violations.
In their presentation, the team said their next step is to apply Coord’s api to add on parking regulation data, so that they could analyze the correlation between parking violations and parking regulations. They also asked that the Mayor’s Office of Data Analytics look into standardizing location data across agencies and departments.
Datasets Used: Parking Violations Issued: Fiscal Year 2019 , 311 Service Requests 2010-Present, NYC Address Points
Project Stats and Outcomes:
- 4.5 hours
- 10 Participants
- Built a Parking Violations Map
- Cleaned and Geocoded Data
- Presentation File
- Presentation Video
Contact:
Janet Liff, @JanetLiff
Jacob Baskin – @jacobbaskin
Reliable Access to Subways
Organized by TransitCenter and United for Equal Access NY
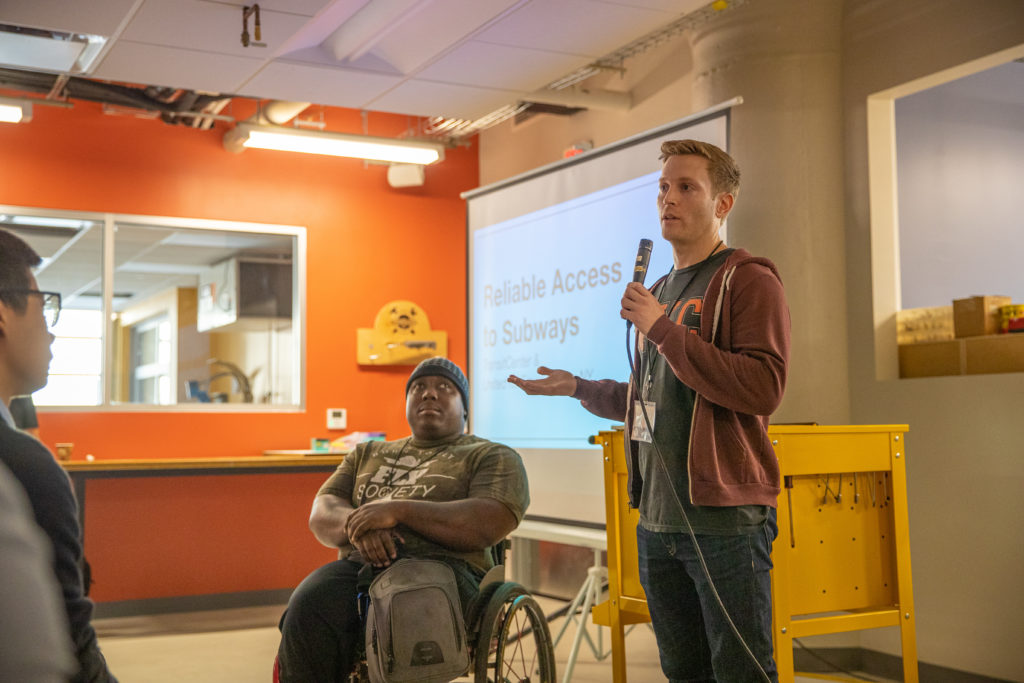
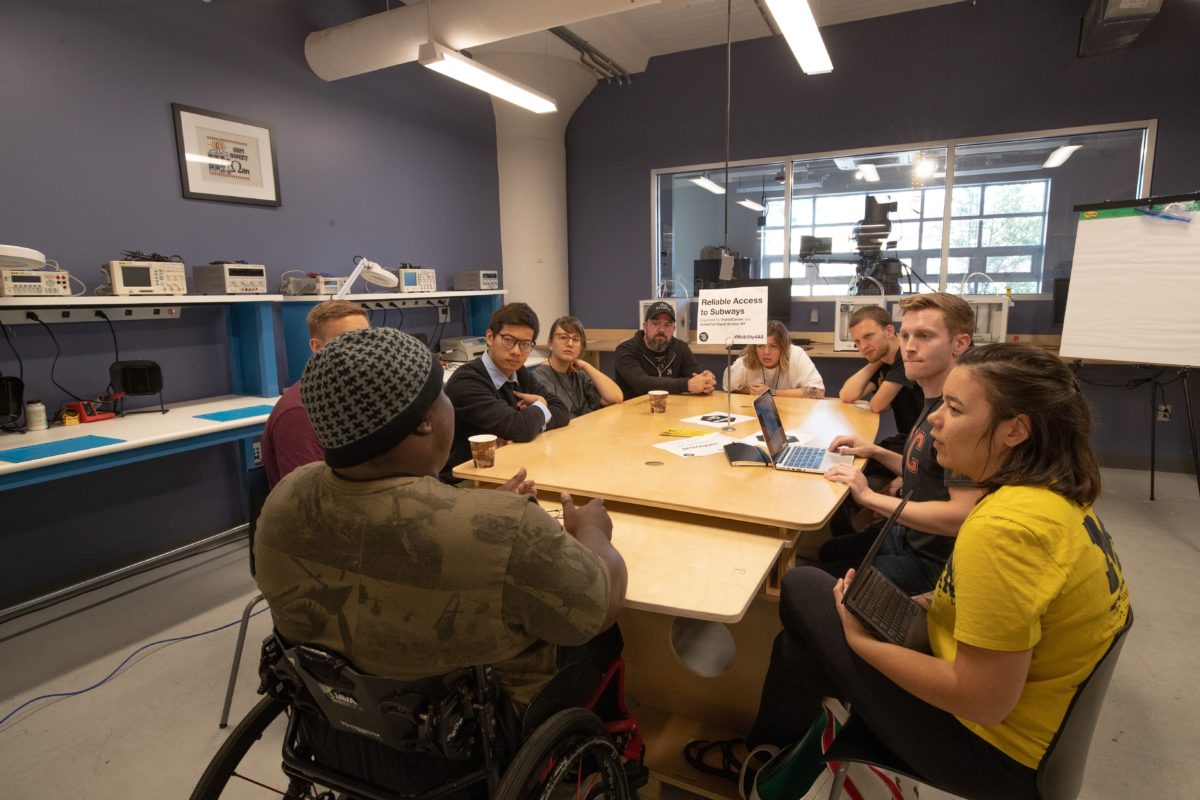
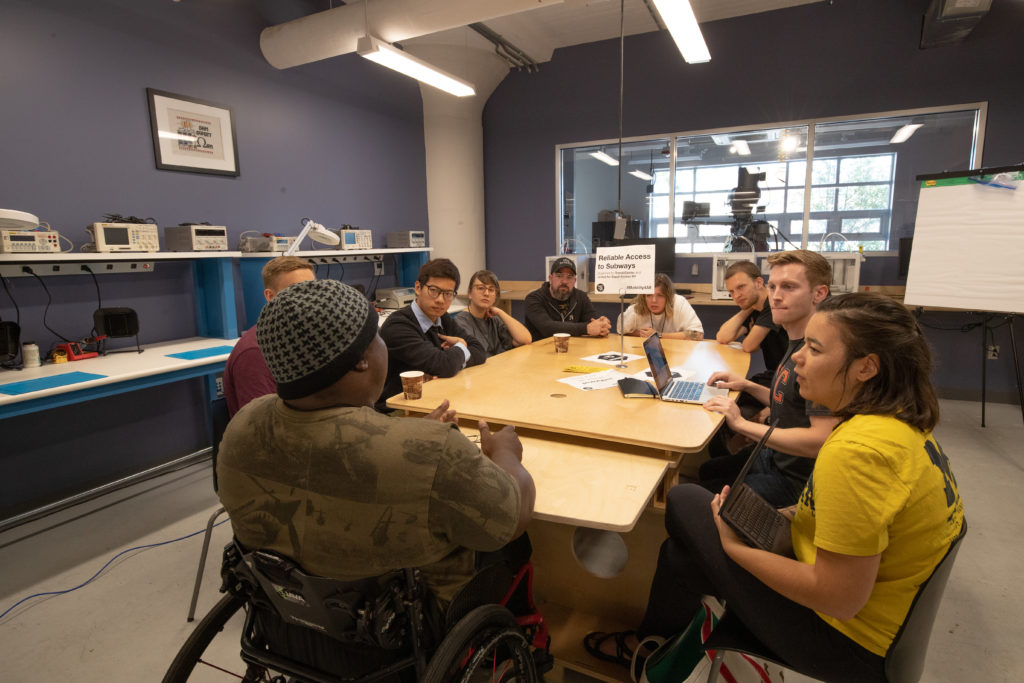
Transit Center presented this challenge to reveal insights into the MTA’s quarterly reports on the subway’s worst performing elevators and escalators. Colin Wright from Transit Center and Dustin Jones from United for Equal Access NY teamed up to facilitate the work with their team.
Participants aligned around the issue with insightful first-hand experience and perspective from Dustin, a long-time advocate for differently abled communities. Together, Colin and Dustin shined light on existing advocacy efforts and the importance of data-driven evidence to advance them.
The team analyzed MTA’s quarterly elevator and escalator performance reports to understand why machines break down so often. Their challenge was to present the data in an insightful way, or to find opportunities to further analyze the data and enhance it. Ultimately, Colin and Dustin want like to use the results in their advocacy to call for better elevators and escalators throughout the city.
Stats and Outcomes
- 9 Participants
- 4.5 hours
- Presentation File
- Presentation Video
- Transit Center will include insights in their November report. Look out for it!
- Key Insights
- Data is presented as a pdf, qualitative, and not standardized
- The elevator with the most entrapments was at Jay Street-Metrotech
- The station with the most entrapments was at 190 St A
- In the last 3 months, there were 3,300 elevator breakdowns and 11,000 escalator breakdowns
- Most elevator ‘entrapments’ were due to debris
- Elevator and escalator safety checks can take days
- Recommendations:

Thank you for supporting this challenge:

Contact:
Transit Center – @TransitCenter
Colin Wright – @cbw623
Dustin Jones – @EqualAccessNy2
Reporting Sidewalk Obstructions
Organized by ChekPeds, Health4Youths and @NYC_Reported
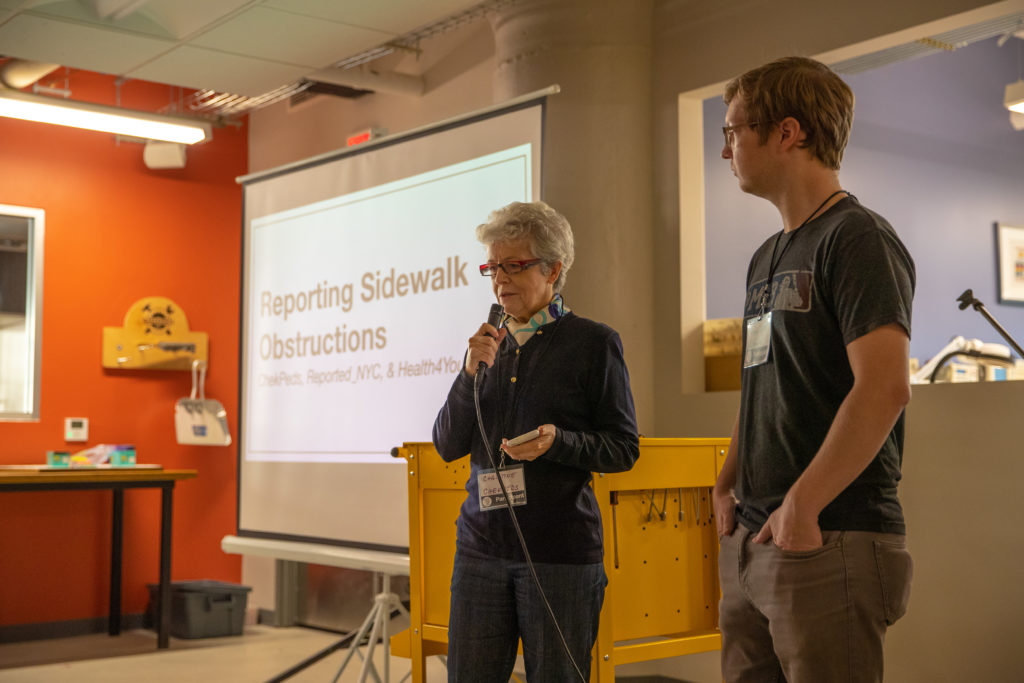
Christine Berthet (CHEKPEDS) and Ryan Gravener (@Reported_NYC) organized this challenge to make sidewalks or “walk lanes,” more walkable for all the people who use them.
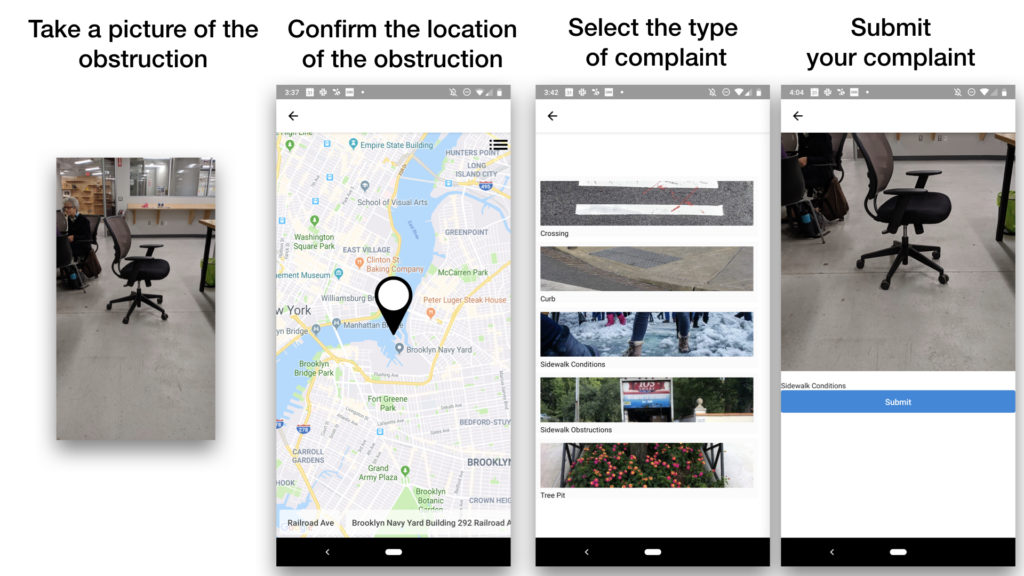
Many sidewalks in NYC are cluttered and/or dangerous to navigate (trash, damaged pavement, little lighting…), especially for people who rely on wheelchair accessible pathways. As Christine describes, there was a noticeable increase in such sidewalk “conditions” in NYC after the responsibility of their maintenance shifted from NYC government to property owners in 2003.
Christine wants to put the power of reporting sidewalk conditions in the hands of the people who use them. She teamed up with the folks at @Reported_NYC, an app that enables New Yorkers to report reckless driving and hold NYC drivers accountable. Together they asked participants to identify backend components and design an interface for an app that would do for sidewalk conditions, what Reported does for reckless driving. At the hackathon the team prototyped a simple visual application for pedestrians to submit reports of sidewalk obstructions directly to 311.
Stats and Outcomes:
- 4.5 hours
- 11 Participants
- Presentation File
- Presentation Video
- Reported-Sidewalk App Prototype
Contact:
Christine Berthet @CHEKPEDS
Ryan Gravener
Jeff Novich @jeffnovich @Reported_NYC
Tracking Trucks
Organized by Council Member Robert Holden District 30, Queens & Council Technology Chair and Facilitated by Alex Curtis and Stephanie Gline
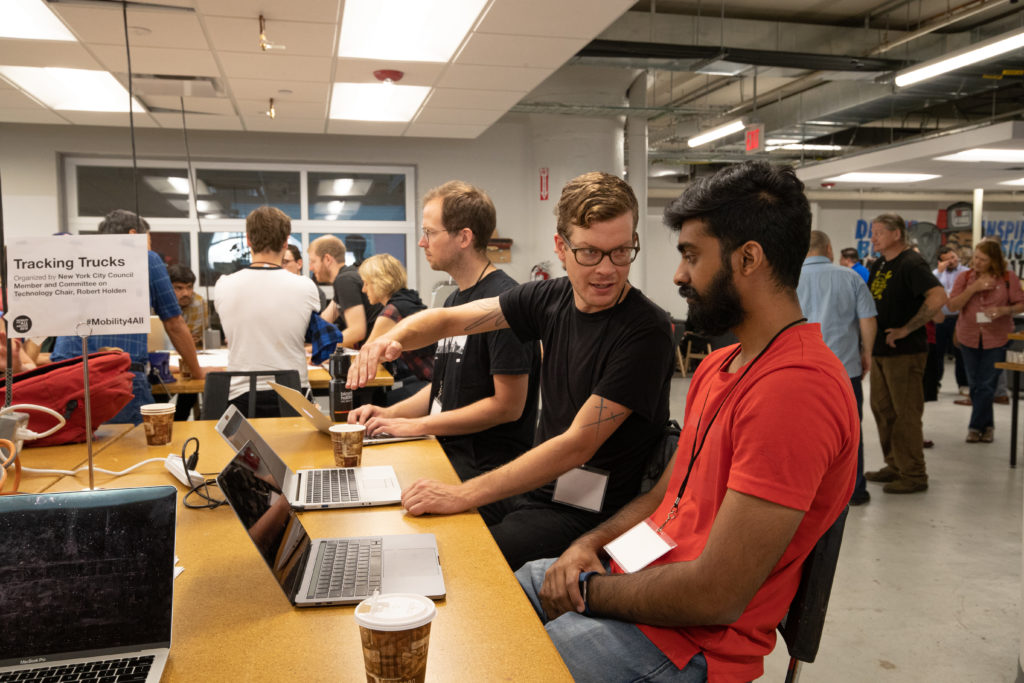
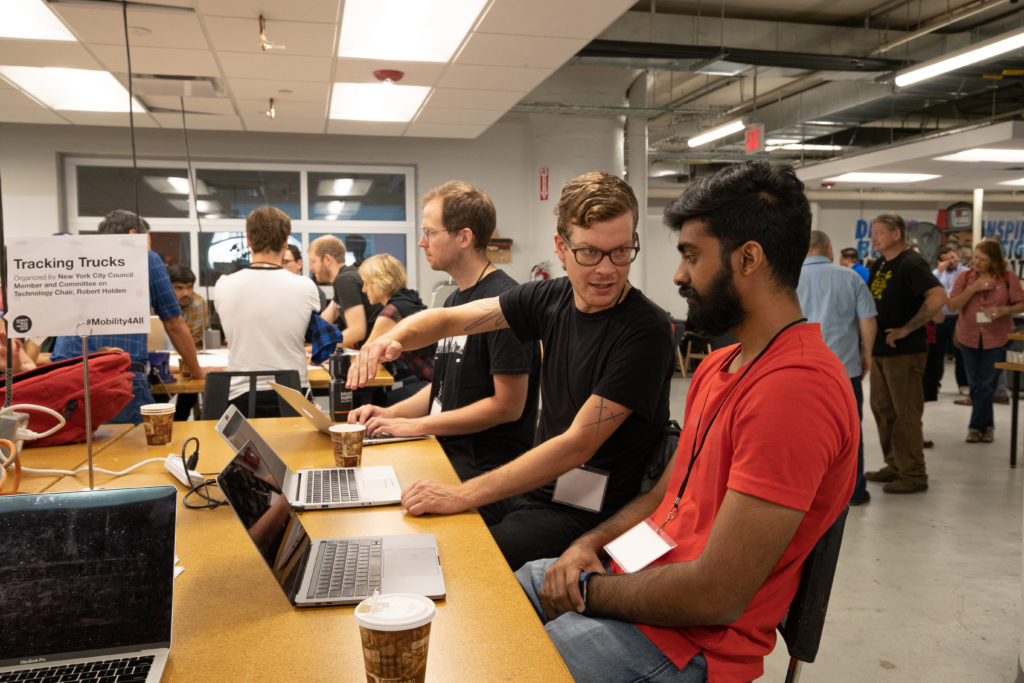
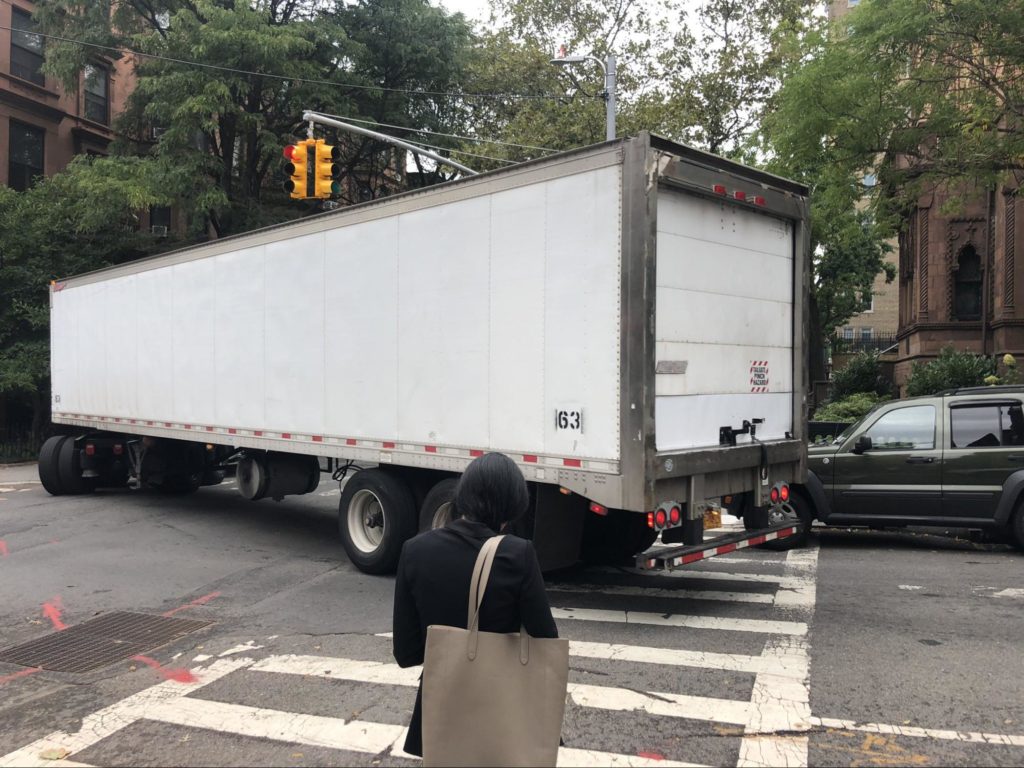
This mobility challenge asked how we can limit illegal truck traffic in NYC. It asked participants to look at the traffic patterns of oversized trucks, which often violate traffic regulations and cause disturbance. For this challenge, participants explored ways they could monitor truck traffic on truck routes and non-truck routes by training a computer to spot 53 foot trucks, pulling data from traffic cams. Ultimately, the team built an online tool for reporting 53-foot trailers that drive illegally in the city.
How they approached the challenge:
- Identify truck routes
- Juxtapose that with the routes they should be taking
- Make use of the 723 intersection cameras live feeds hosted by NYC DOT
- Map camera locations and their identified truck observations
- Object localization and camera perspective/placement compensation to specifically identify 53-foot trucks
What else did participants do?
- Crowdsourced reports from Twitter (@illegal53NYC) and Reported App
- Tried to find supplemental data in 311 and all reported NYC traffic collisions
- Documented all NYC truck routes
- Documented camera locations
- Documented restricted routes for oversized vehicles
- Looked at permitted oversized vehicles
Stats and Outcomes:
- 4.5 hours
- 7 participants
- Presentation File
- Presentation Video
- 53 Foot Truck Reporting App:

Team Recommendations for future work:
- Long-term collection of image data for sufficient observations of oversized trucks
- Assess method of identifying 53’ trucks with high confidence using perspective-normalized bounding box area
- Look at truck hotspots in the city and place additional cameras/policemen to monitor them.
- Determine viability of NYPD summons data for independent quantification illegally sized trucks
- Train custom object detector for 53’ trucks and design detection system to work with real-time traffic cameras.
Contact: Interested in this project? Tell kate{at}beta{dot}nyc.
Tweets we loved:
Livestream Videos
Produced by Maker Park Radio @makerparkradio
Welcoming Remarks
00:00:00 Scott Van Campen, MakerSpace NYC
00:02:09 Noel Hidalgo, BetaNYC
{Special Guests and Partners)
00:05:44 Council Member Brad Lander
00:13:00 Zachary Feder, Mayor’s Office of Data Analytics
00:19:00 Ian Straughter, Mayor’s Office for People with Disabilities
00:27:15 John Paul Farmer, NYC Chief Technology Officer
00:31:42 Nathan Sherfinski, Brooklyn Borough President’s Office
00:33:23 Daniel Alam, Manhattan Borough President’s Office
00:37:15 Kristin Wallace, Maker Park Radio
00:38:07 Noel Hidalgo, BetaNYC
{Challenge Introductions}
00:50:30 Alternative & Inclusive Futures for Mobility – Crystal Penalosa
00:52:25 Bicycle Mapathon – Amber Knee, Department of Transportation
00:54:00 Bicycle Networks x Redlined Districts – Courtney Williams
00:56:35 Managing Curbside Chaos – Janet Liff, Open Plans and Jacob Baskin, Coord
00:59:30 Mapping NYC’s Sidewalks & Pedestrian Ramps – Eric Brelsford
01:00:04 Reliable Access to Subways – Colin Wright, TransitCenter and Dustin Jones, United for EqualAccessNY
1:03:52 Reporting Sidewalk Obstructions – Christine Berthet, ChekPeds
1:07:00 Tracking Trucks – Kate Nicholson, BetaNYC
Team Presentations
00:00 Bicycle Districts x Redlining
05:30 Curbside Chaos
15:45 Reliable Access to Subways
26:25 Reporting Sidewalk Obstructions
32:45 Tracking Trucks
39:09 Alternative & Inclusive Futures for Mobility
00:00 Mapping NYC’s Sidewalks and Pedestrian Ramps
Interviews:
Christine Berthet, CHEKPEDS and Janet Liff, Open Plans
Colin Wright, Transit Center
Dustin Jones, United for Equal Access NY
Michael JohnDuff, Transportation Alternatives
Event Photos
Album on Google Drive
Credits: Photographs by Charlie Hartwell

