In March, we hosted the seventh annual NYC Open Data Week festival with the NYC Open Data Team at the Office of Technology and Innovation (OTI) and Data Through Design.
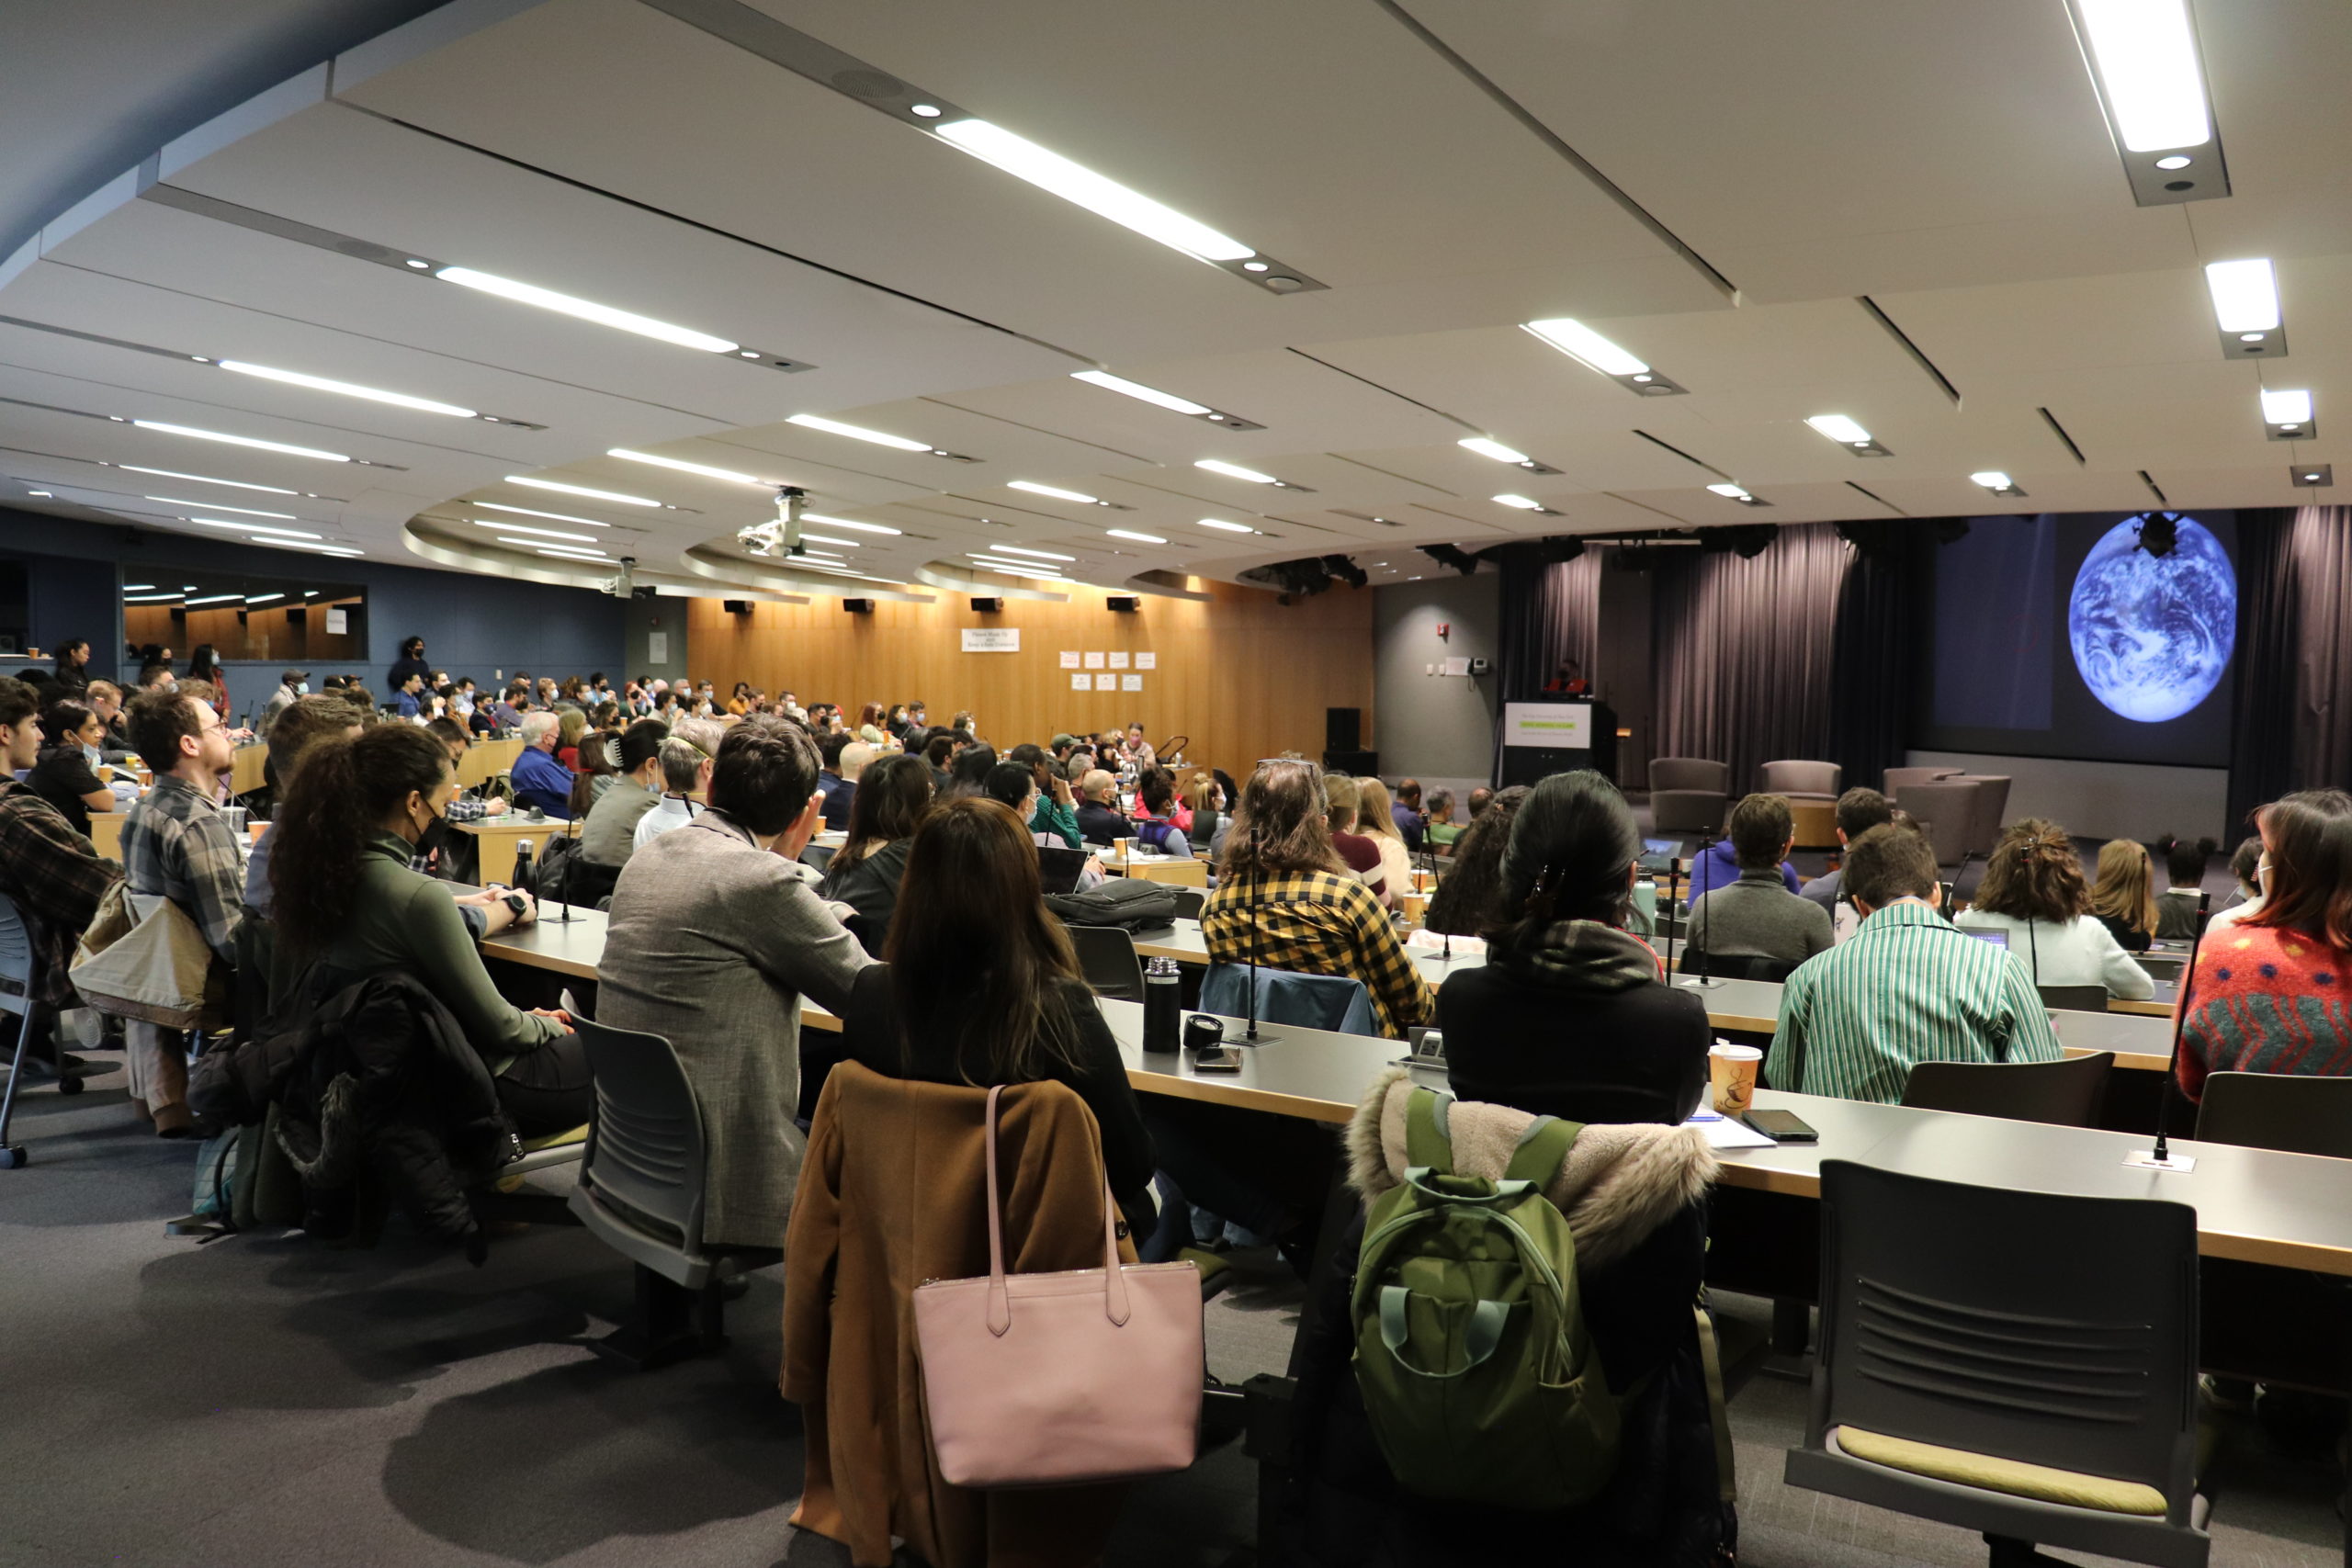
Based upon this year’s survey data, people were especially interested in NYC agencies’ use of data, and we were excited to welcome over 800 new people to the civic tech sphere.
Throughout the week, we had 2,946 participants tune into 47 virtual events — there were 6 in-person and 5 hybrid events — NYC School of Data, closed the week with 31 sessions. In total, there were 88 events!
“We support events like [NYC School of Data and NYC Open Data Week] to ensure the opportunity to provide data to actually advance equity in New York City.”
Keesha Gaskins-Nathan, Rockefeller Brother Fund
Every single event put a focus on NYC open data. Thank you to the 199 presenters who discussed topics ranging from water quality, mobility and mapping, to education, Women’s History Month and data ethics. To top it all off, we continued the tradition of holding a virtual breakfast each weekday; we really need to get a coffee and bagel sponsor!!
Since 2020, we’ve learned that holding virtual events has its perks. Thanks to Joly MacFie and the Internet Society, New York Chapter, we have 66 event recordings published on our website. Enjoy and be sure to share them with your friends and loved ones!
Program Highlights
NYC Open Data Week
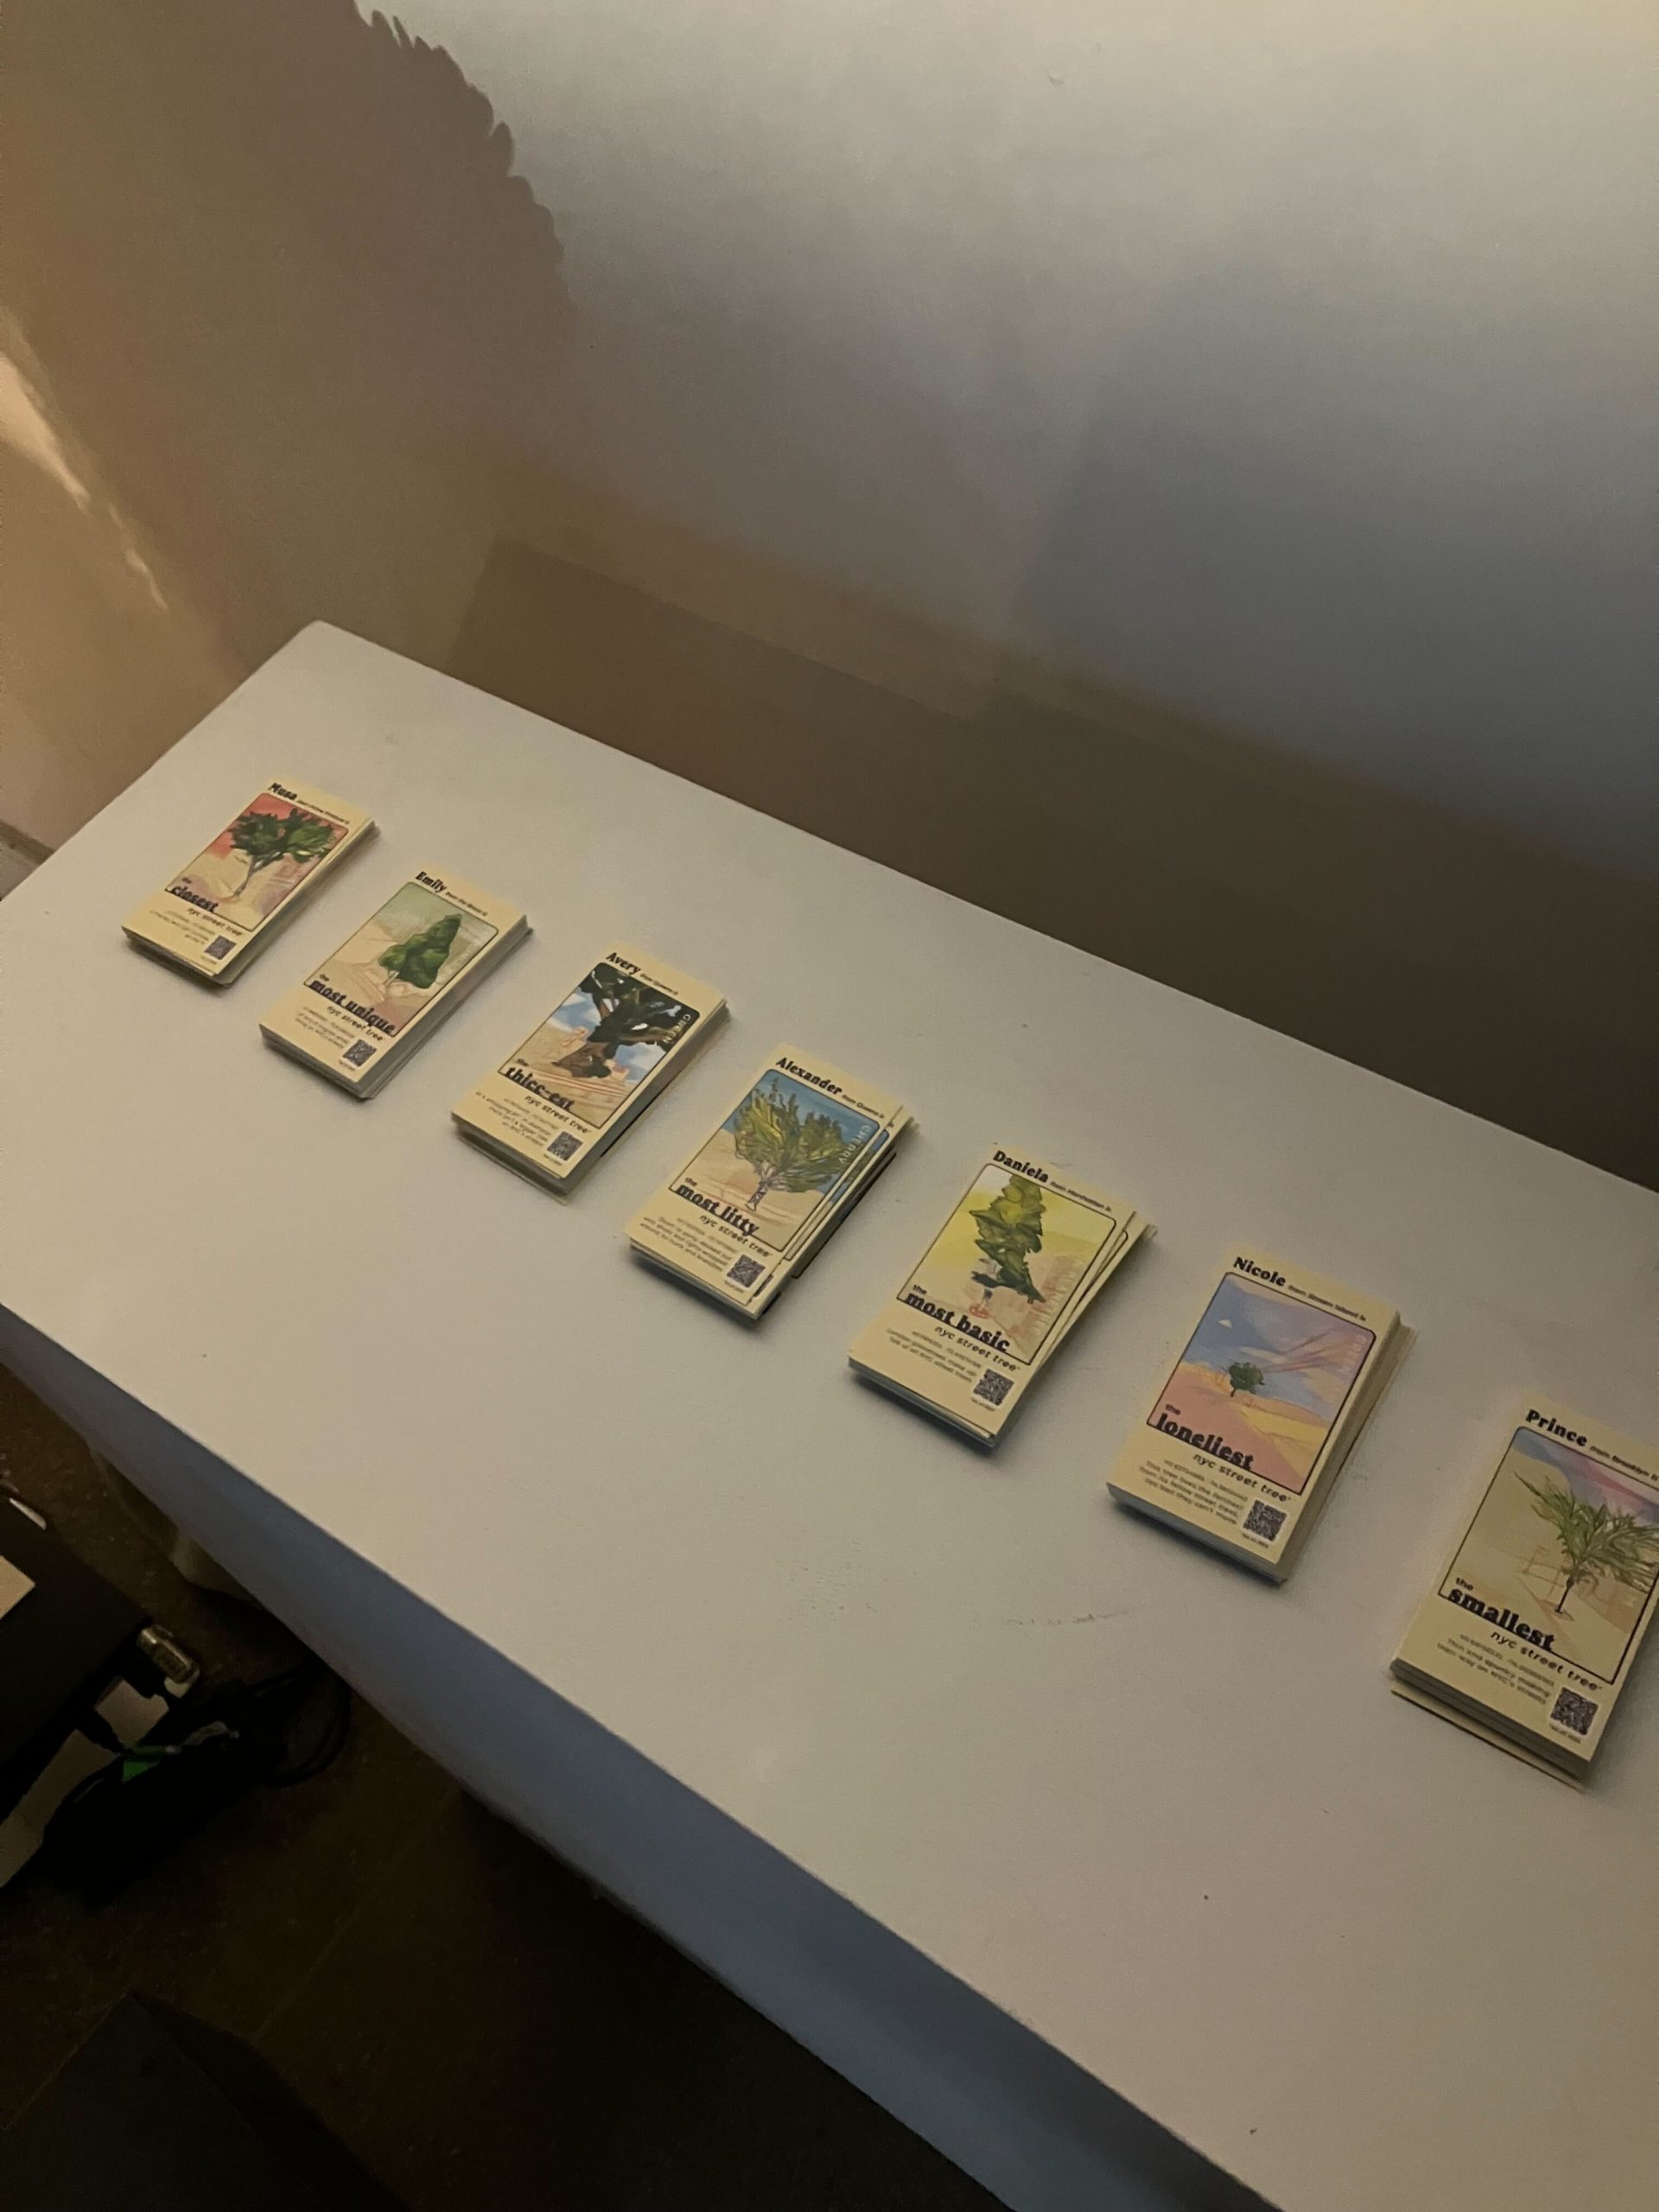
Each year, Data Through Design holds a thematic exhibition, featuring works that creatively analyze and illustrate the treasure trove that is NYC Open Data. This year’s theme was Hidden in Plain Sight, which asks us to consider the smaller stories, “invisible hands” and voices that are hidden in the big data narrative.

Throughout the week, certified instructors from BetaNYC, the NYC Open Data Team and the NYC Open Data Ambassadors program introduced NYC Open Data in nine Discovering NYC Open Data classes. One of the Ambassadors, Chief Analytics Officer Martha Norrick, even held a class during NYC School of Data!
“Open Data is a collection of data. But it’s also a collection of incredibly hardworking public servants whose diligence and stewardship make the Open Data program possible.”
Martha Norrick, NYC Chief Analytics Officer
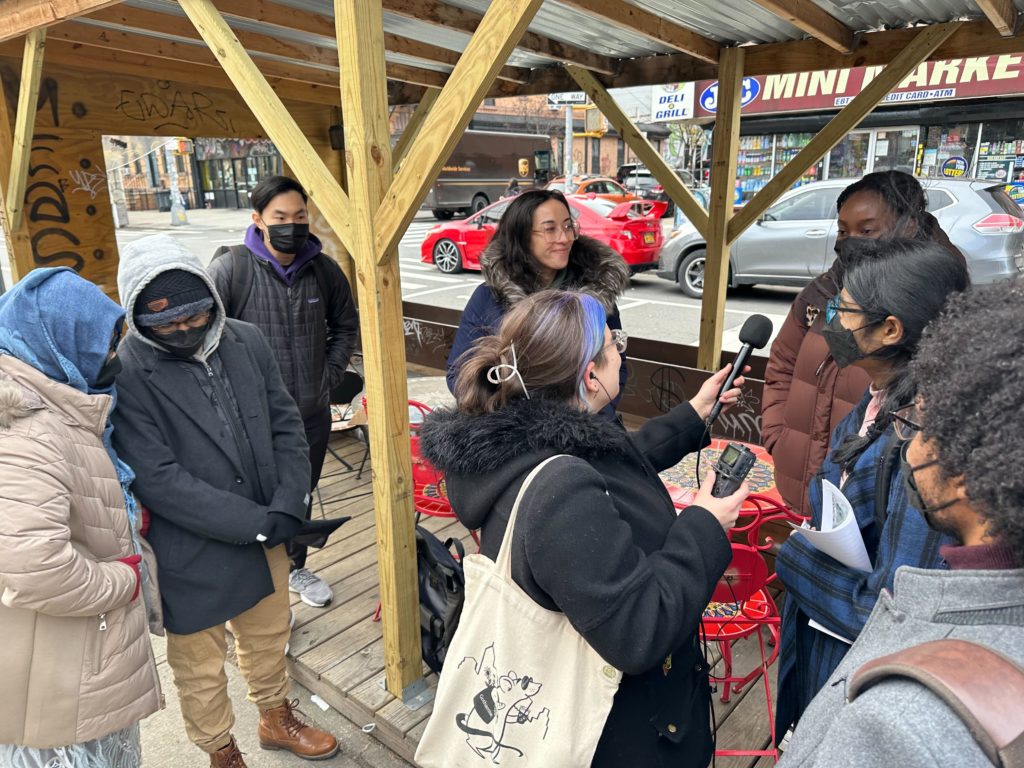
Fellows from our Civic Innovation Fellowship ventured into Bushwick’s Maria Hernandez Park as part of their Mapping for Equity project. Their work received coverage in the paper and was featured by CUNY on Instagram! Also, the Office of the NYC Comptroller hosted three events on their dashboard Checkbook NYC, which illustrates the City’s spending and makes these metrics accessible to the public.
NYC School of Data
“Small things really do matter. As we are a small thing in a big, big universe. We are here together to share each other’s company, to share each other’s knowledge and to engage in small acts of kindness.”
Noel Hidalgo, Executive Director at BetaNYC
On March 18, we returned to CUNY School of Law, once again offering services such as free childcare! It was emotional to be back in the same room as our last, large, in-person event before the shutdown.
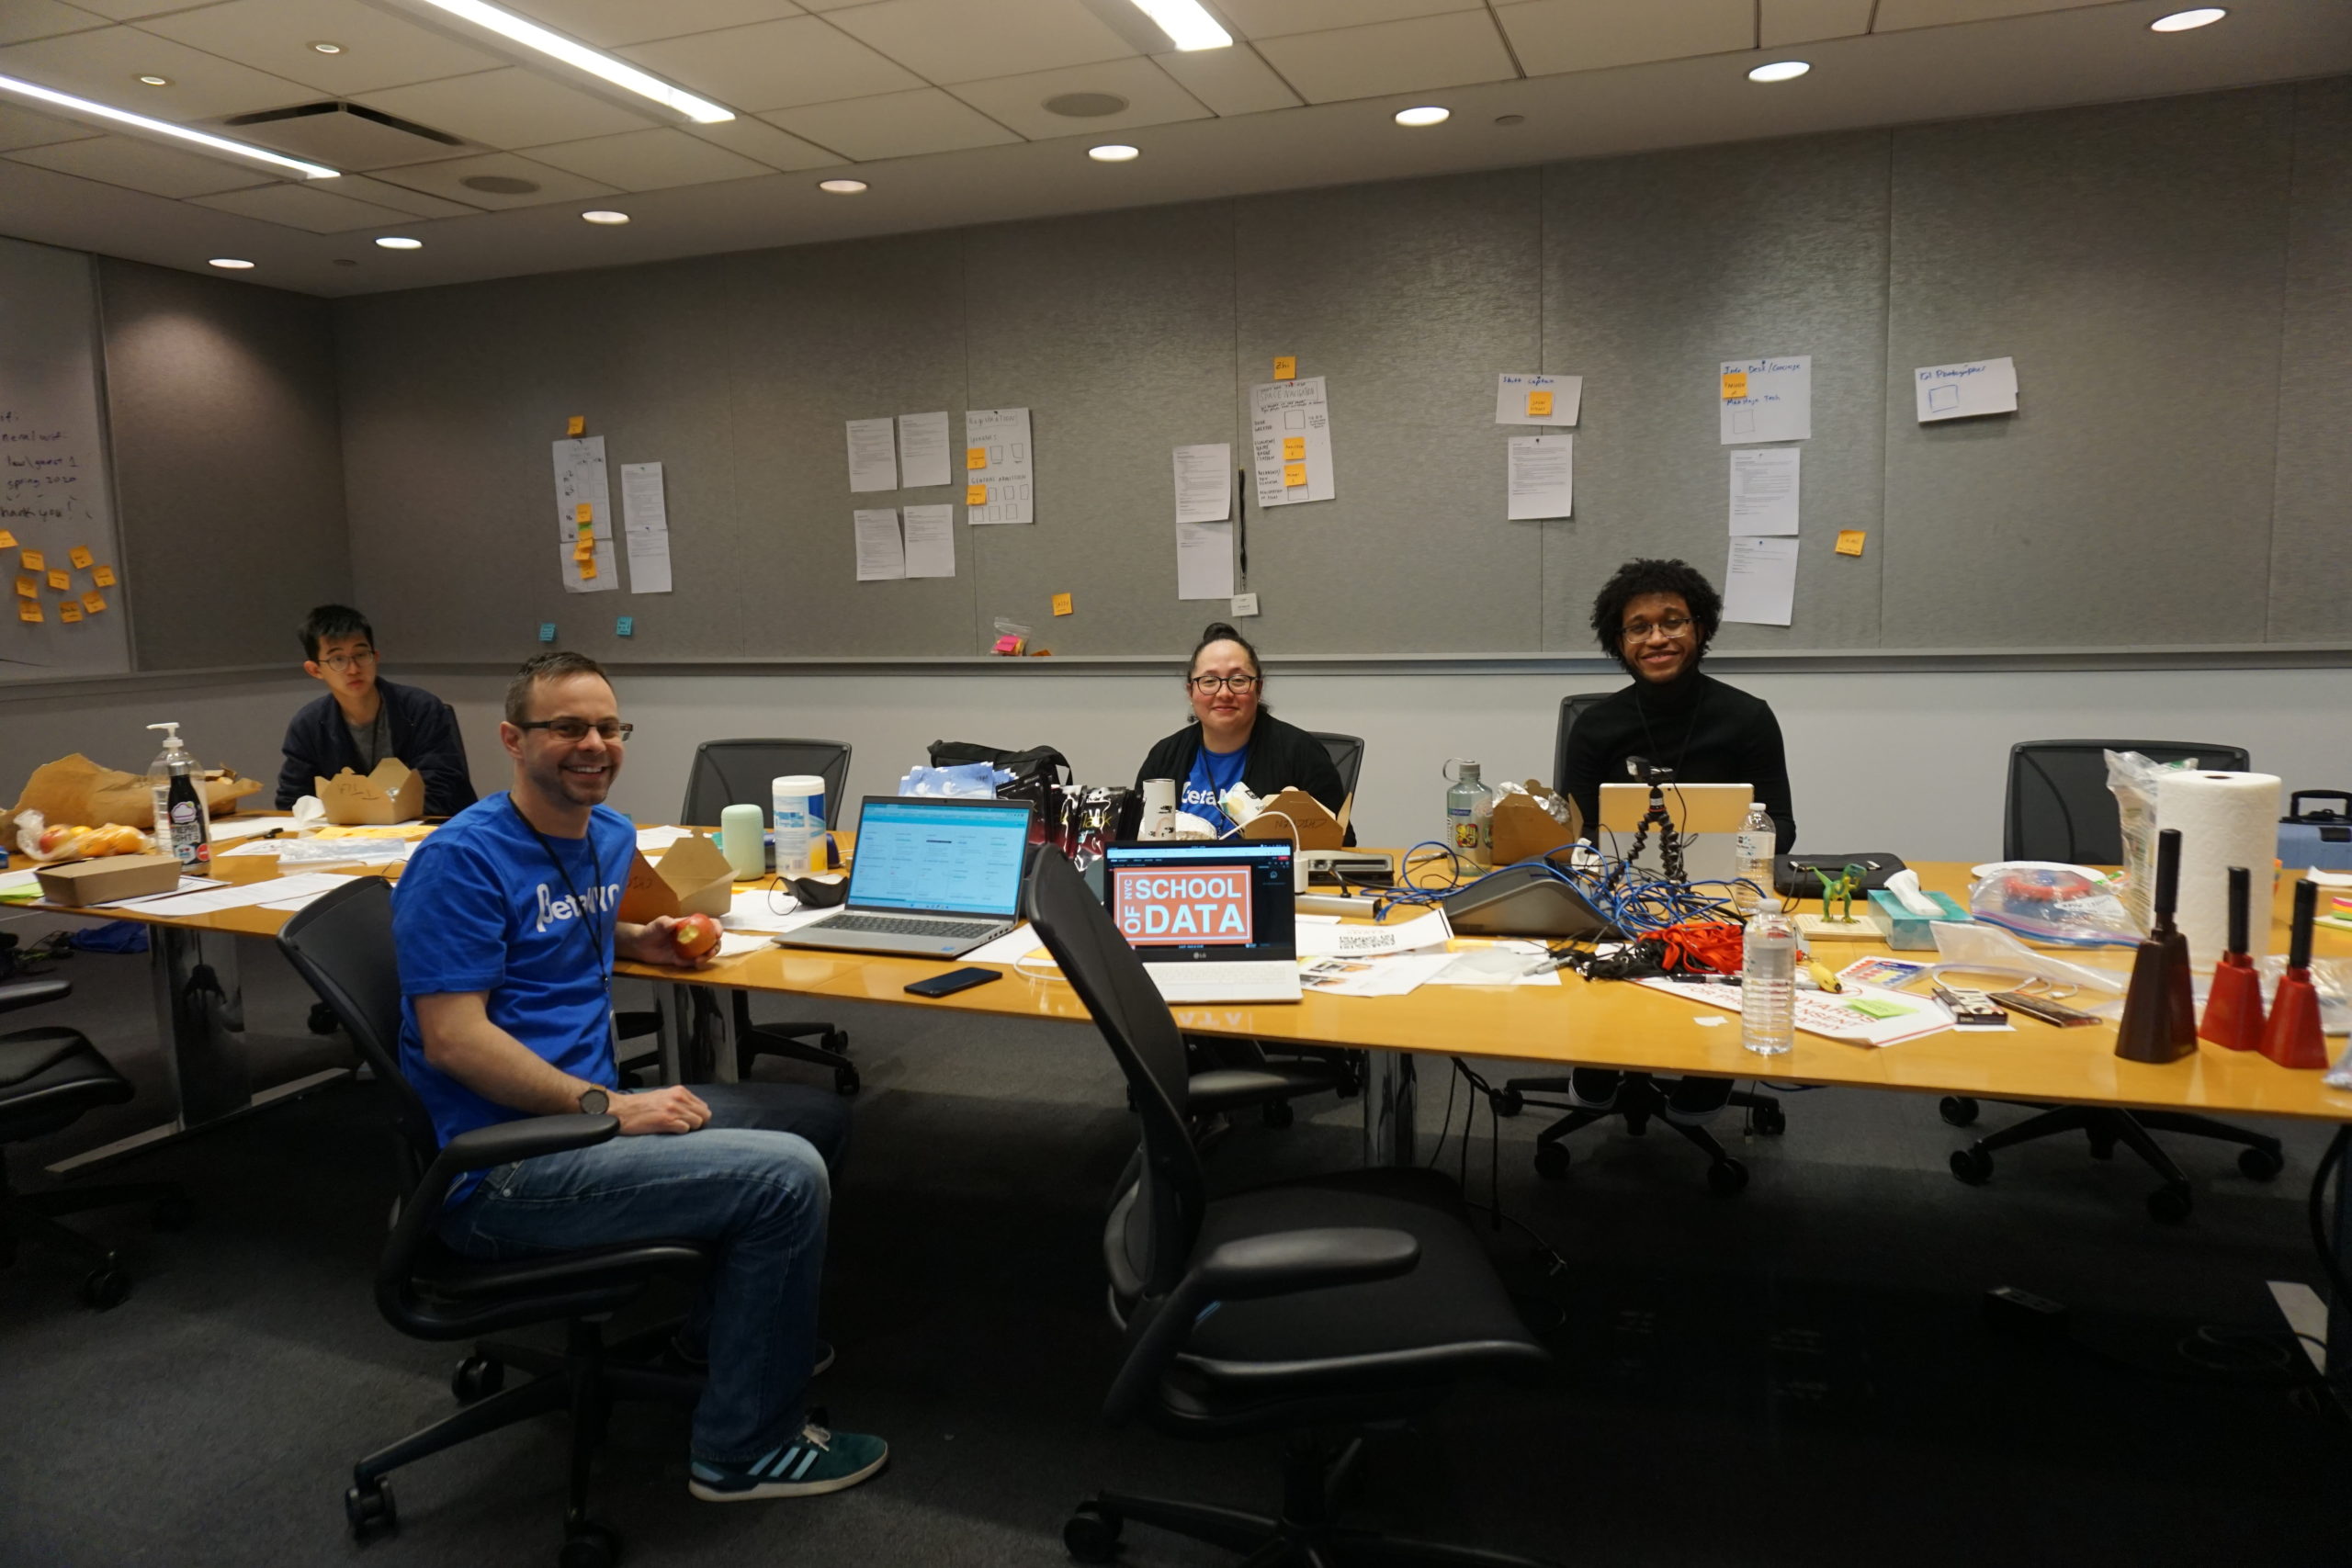
In three short years, our world has changed, and we were determined to create a memorable day for everyone. Thank you to our 52 stellar volunteers who assisted with event production and made everything less of a whirlwind for us all!
The morning kicked off with an opening keynote hosted by Noel Hidalgo, and featured honoree speakers State Senator Kristen Gonzalez, Councilmember Julie Won, Councilmember Jennifer Gutiérrez, Chief Analytics Officer Martha Norrick and Rockefeller Brothers Fund’s Keesha Gaskins-Nathan. Be sure to check out their opening remarks and keynotes.
“I want to create access for everyone to be able to use tech to more fully participate in society, and that technology needs to work for everyone. The digital divide is still very real.”
Councilmember Jennifer Gutiérrez
“We need the internet to be considered a utility and a right everyone should have access to. And so in launching the internet for All Initiative, we were fighting for it to be a public utility. All of you are the people who give me hope.”
State Senator Kristen Gonzalez
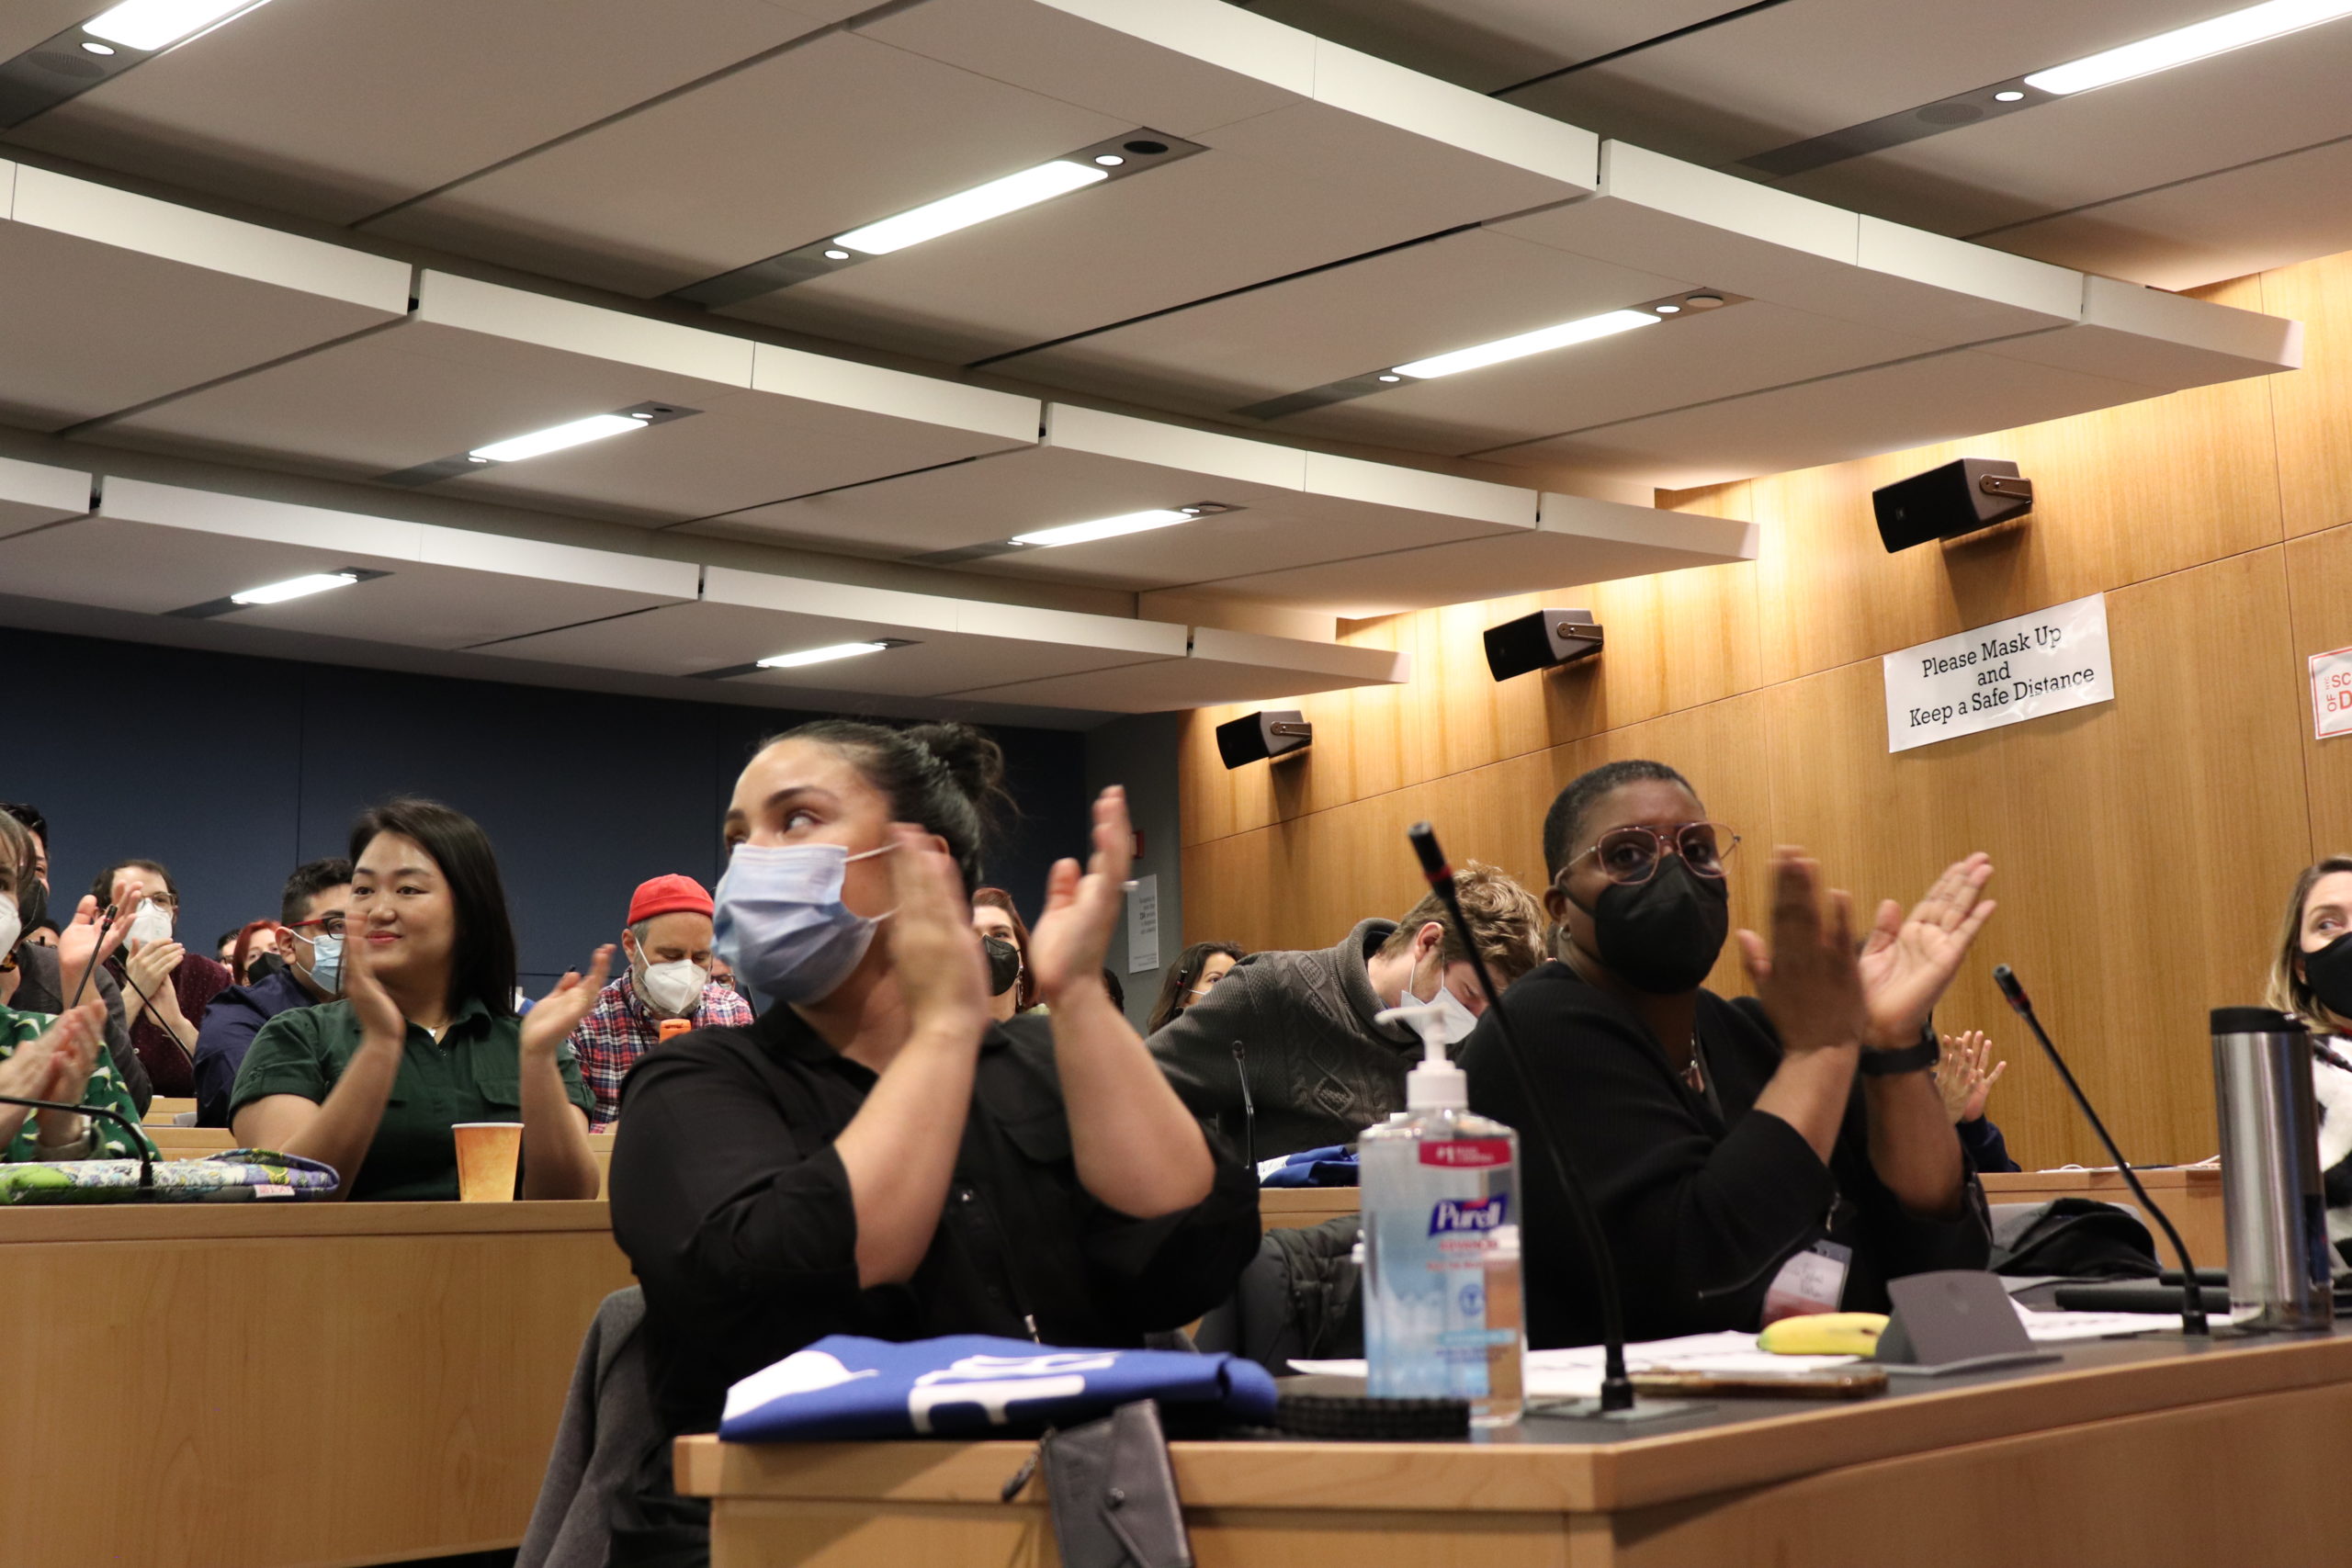
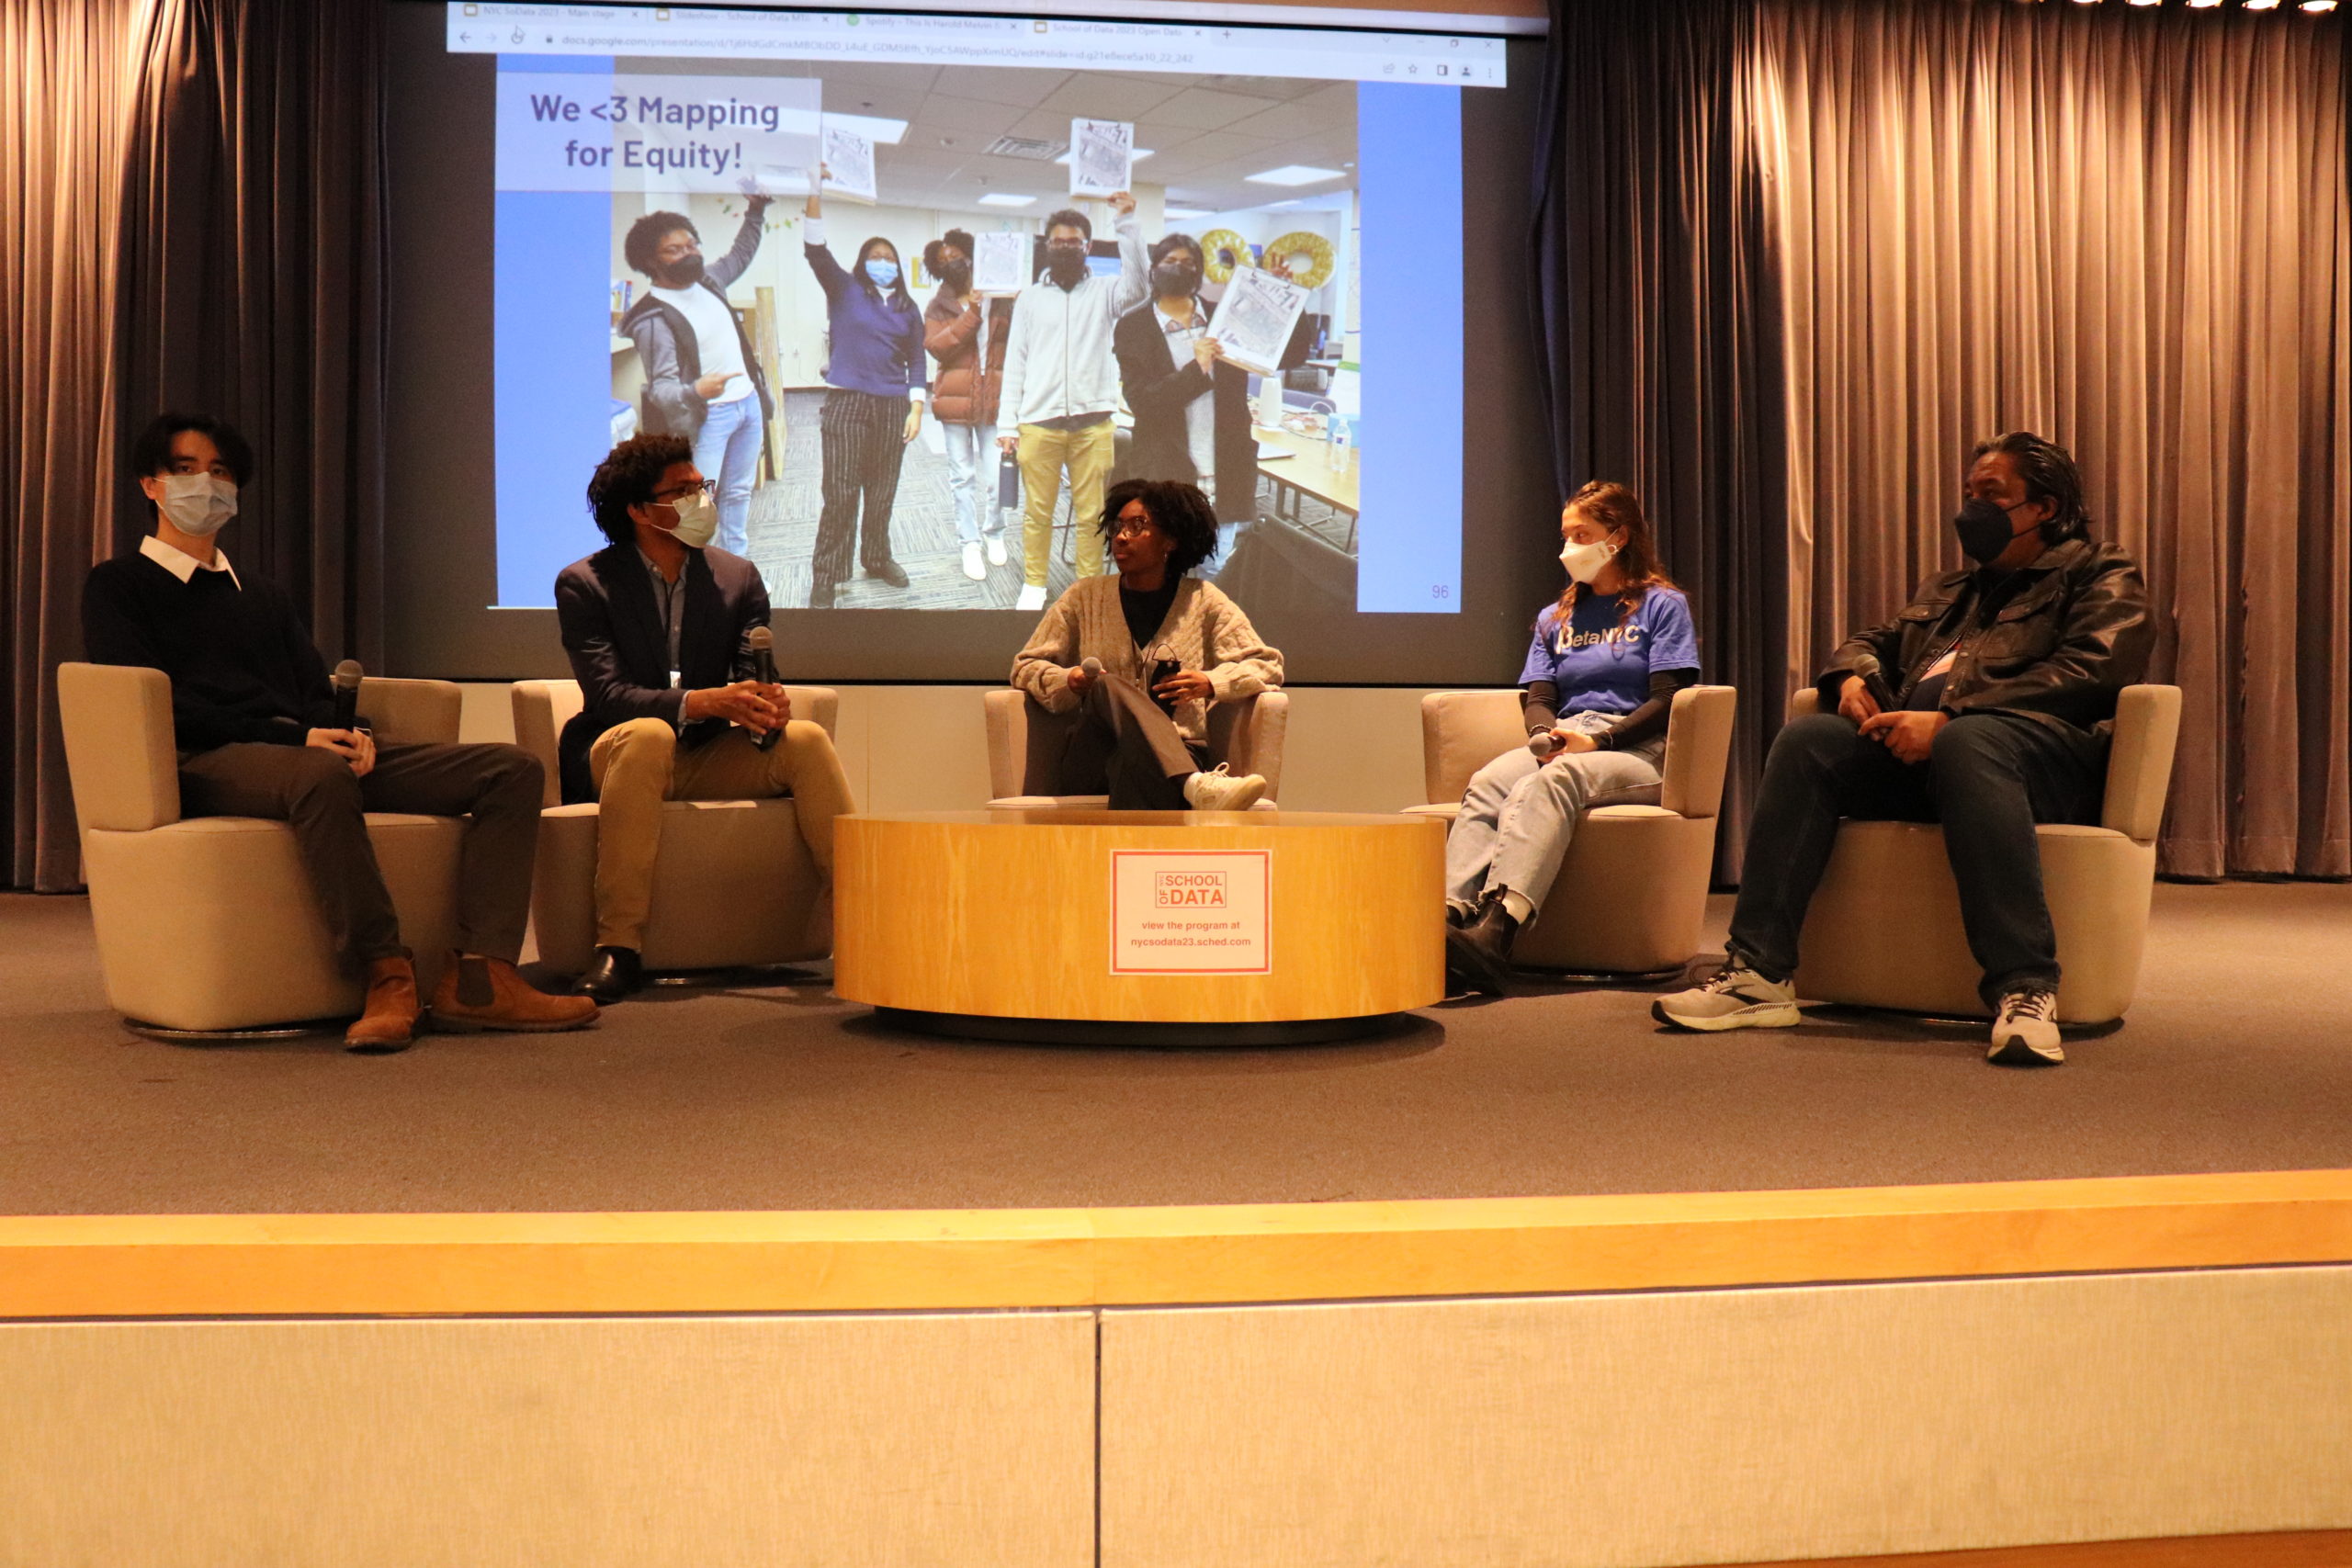
The rest of the day featured a curated collection of sessions! Assemblymember Robert Carroll, State Senator Jessica Ramos, Riders Alliance’s Danny Pearlstein and Reinvent Albany’s Rachael Fauss hosted a panel discussion on recent MTA transparency legislation. Also, BetaNYC’s Dimitri Mimy, Erik Brown and Kyla Browne, along with Retool’s Lizzie Alvarado Ford, NYU’s Jonathan Gao and DatHere’s Joel Natividad held a PechaKucha lightning talk on different ways to leverage Open Data.
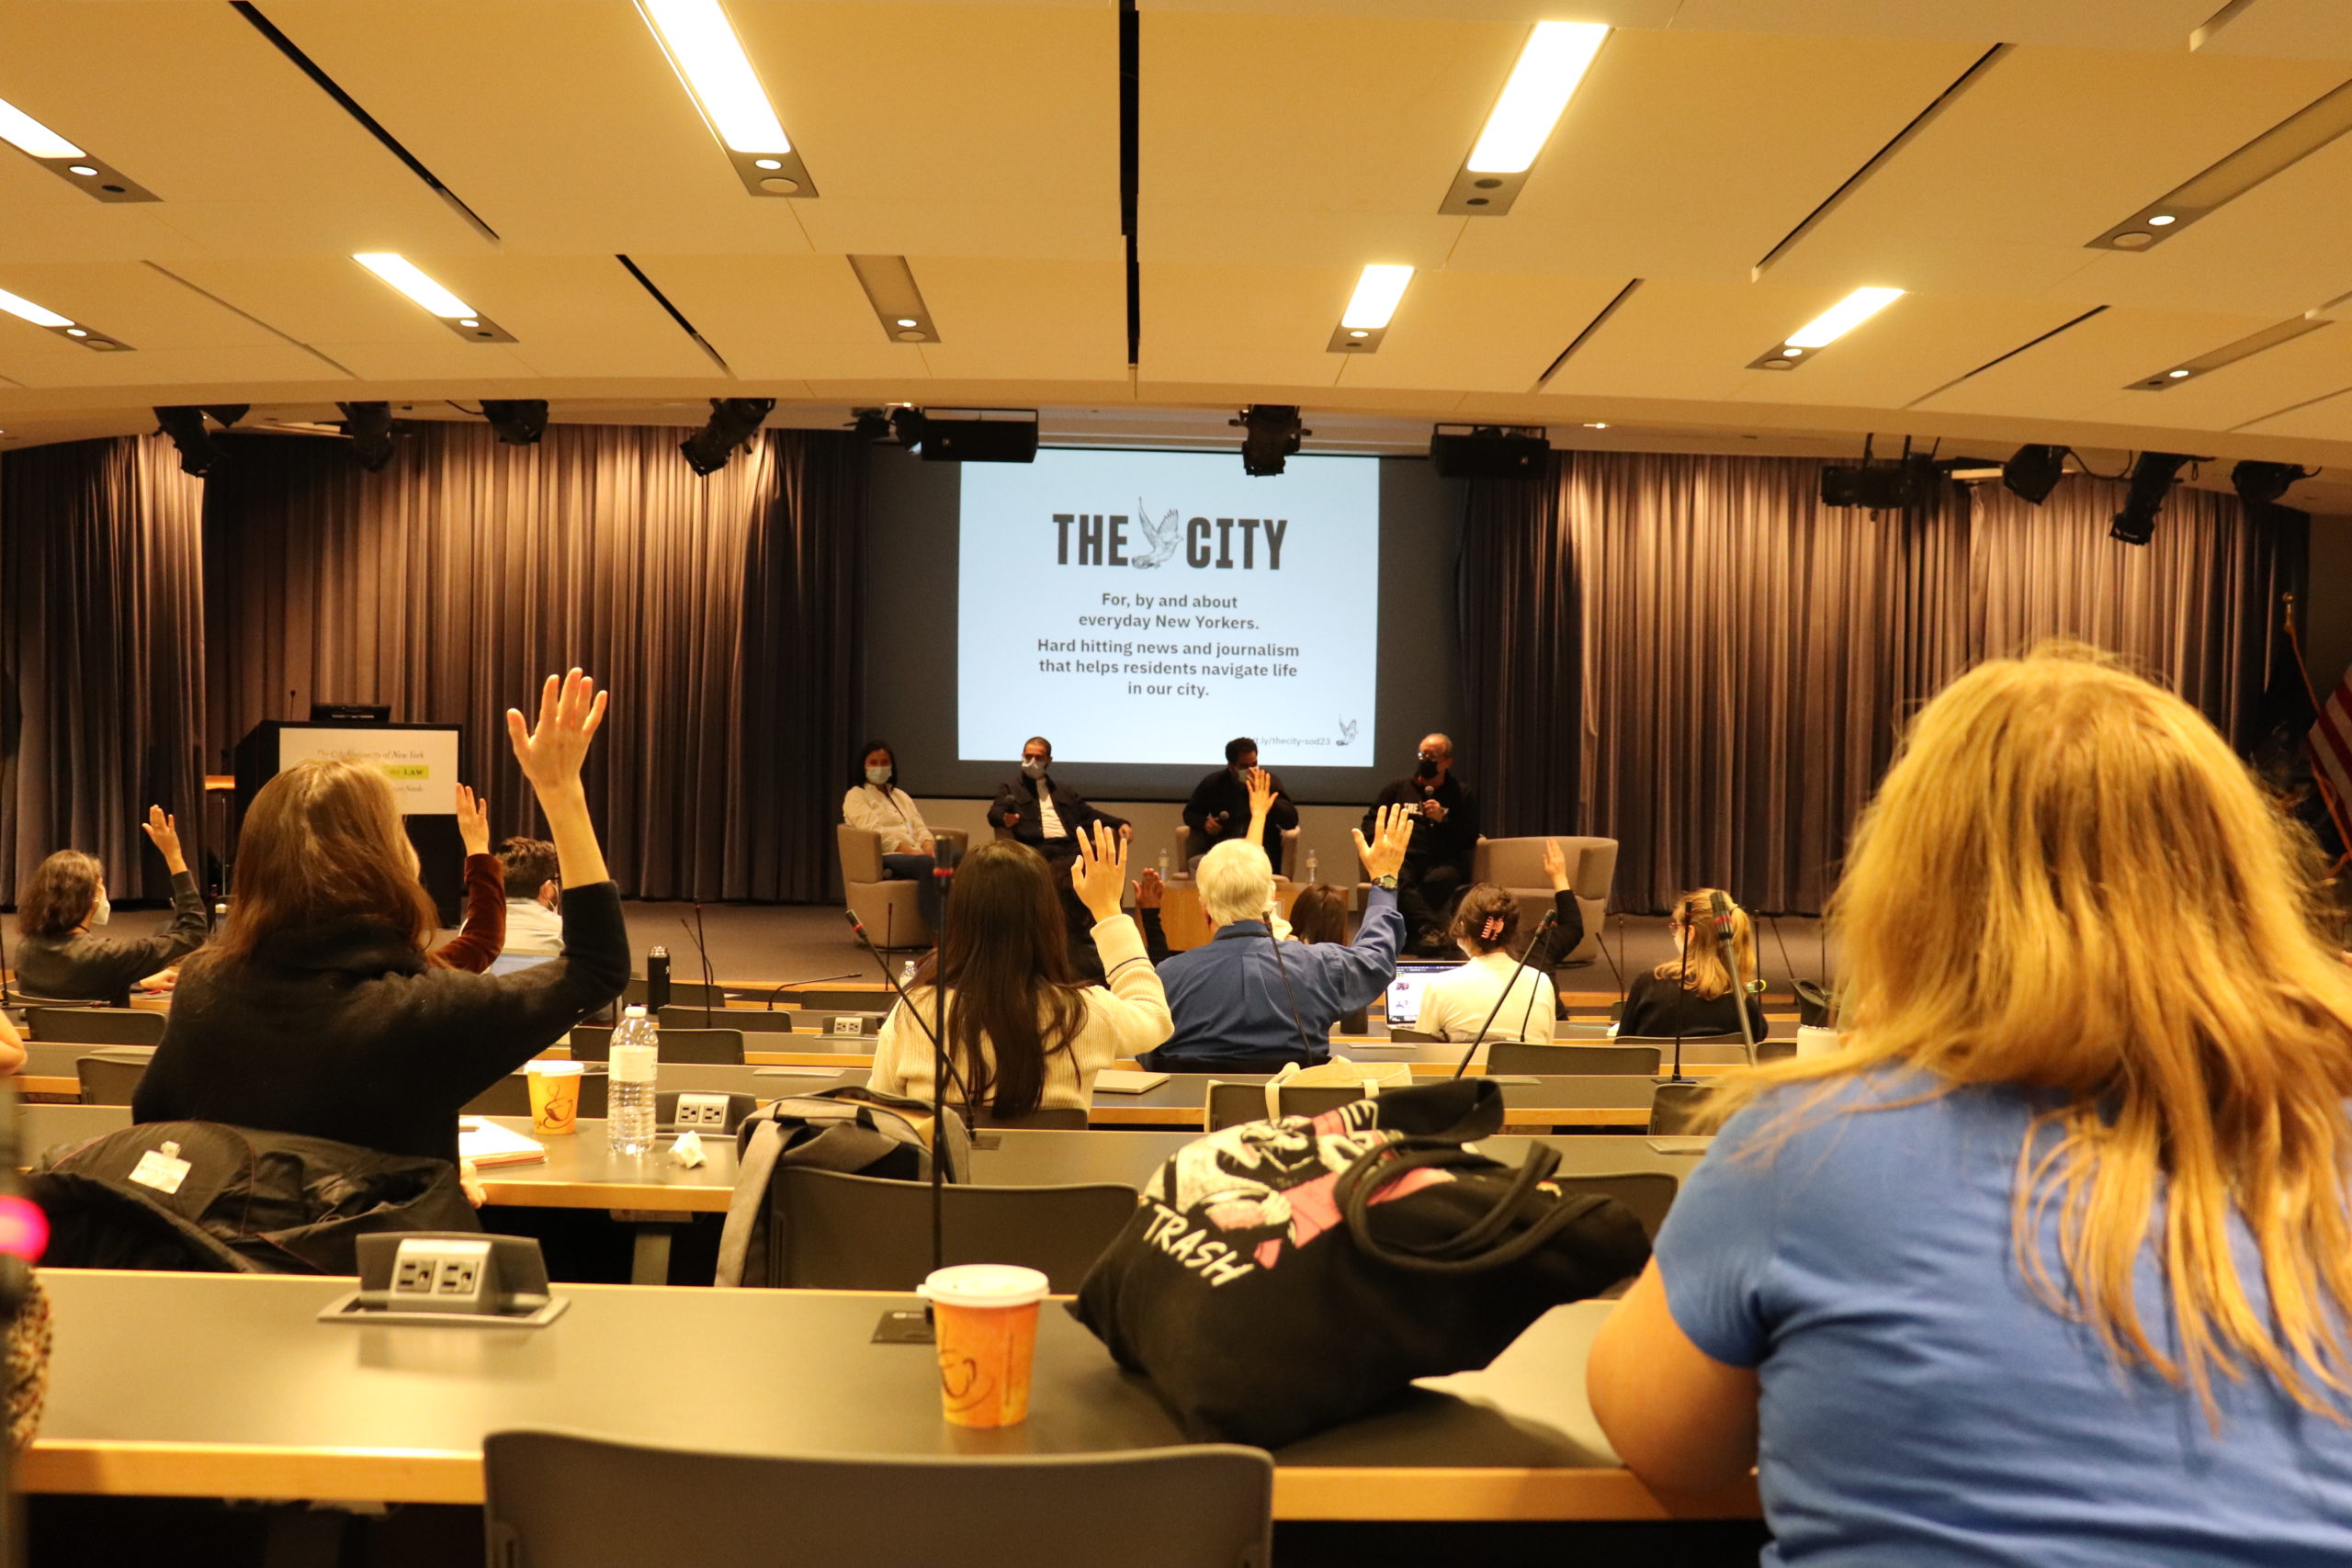
THE CITY’s Scott Klein, Suhail Bhat, Sam Rabiyah and Anjali Tsui walked us through various award winning data journalism projects. And VHB’s Andrew Buck, NYC Department of City Planning’s Winnie Shen, NYC Mayor’s Office for Economic Opportunity’s Sara Shoener, Transportation Alternatives’ Juan Restrepo and NYC Speaks’ Dr. Shango A. Blake did a deep dive into community planning processes and spatial equity.
We had a fabulous week and hope you’ll consider joining us next year! Thank you to the 199 session organizers. We couldn’t have done this event without you. If you missed any of our recorded sessions, you can enjoy them on the Open Data Week website.
Thank you NYC School of Data Sponsors and Partners
New York City’s Office of Technology and Innovation, Reinvent Albany, THE CITY, ESRI, Alfred P. Sloan Foundation, Rockefeller Brothers Fund, and CUNY Law School.
Event Stats for NYC Open Data Week
NOTE: includes all the compiled metrics for NYC School of Data.
Program
| # Sessions / Events # virtual # in person # hybrid | 58 events 47 online events 6 in-person events* 5 hybrid events *1 of the in-person events, NYC School of Data, comprised 31 sessions for a total of 58+31 = 88 sessions |
| # Organizers | 199 |
| # of unique NYC Open Datasets | 104 (out of reported 45 events) |
Participation
| # Participants at 47 virtual events | 2,946 |
| Average # of Participants per virtual event | 63 participants / event |
Ticketholder / Registrant Information
| # Registrants or Ticket Holders | 2516 unique registrants 5033 registrants across all events |
| Average # of Ticket Holders per event | 87 Ticket Holders / event |
| % under age of 25 | 9% (118) |
| % age 25-34 | 41% (527) |
| % age 35-44 | 24% (314) |
| % age 45-64 | 21% (267) |
| % 65 and older | 5% (67) |
| # Pronouns – She/Her/Hers | 793 (61%) |
| # Pronouns – He/Him/His | 465 (36%) |
| # Pronouns – They/Them/Theirs | 36 (3%) |
| # Pronouns – Other | 8 (0.6%) |
| # Work in Government | 753 (51%) (1469 responses total) |
| % NYC | 75% (963) |
| % NYC Metro Area | 87% (1119) |
| % U.S. | 96% (1235) |
| % NYC Boroughs for NYC Residents | 63 (7%) Bronx 395 (41%) Brooklyn 271 (28%) Manhattan 197 (20%) Queens 37 (4%) Staten Island |
| % Non-US Countries | 4% (50) |
Event Stats for NYC School of Data
NOTE: NYC School of Data is one of the six in-person events held during NYC Open Data Week.
Program
| # Sessions / Events | 31 |
| # Organizers | 85 |
| # Volunteers | 52 |
| # Participants / Attendees | 346 |
| # Registrants or Ticket Holders | 423 |
Ticket Holder / Registrant and Attendee Information
| Ticket Holder / Registrants | Attendees | |
| % under age of 25 | 15% (62) | 15% (51) |
| % age 25-34 | 50% (206) | 52% (174) |
| % age 35-44 | 23% (96) | 23% (76) |
| % age 45-64 | 10% (40) | 8% (28) |
| % 65 and older | 2% (9) | 2% (7) |
| Ticket Holder / Registrants | Attendees | |
| # Pronouns – She/Her/Hers | 187 (46%) | 156 (47%) |
| # Pronouns – He/Him/His | 190 (47%) | 153 (46%) |
| # Pronouns – They/Them/Theirs | 14 (3%) | 14 (4%) |
| # Pronouns – Other | 1 (0.2%) | 1 (0.3%) |
| Ticket Holder / Registrants | Attendees | |
| # Work in Government | 147 (36%) (404 Responses total) | 125 (38%) (330 responses total) |
| % NYC | 84% (342) | 84% (279) |
| % NYC Metro Area | 94% (380) | 93% (307) |
| % U.S. | 99.5% (403) | 99% (329) |
| % NYC Boroughs for NYC Residents | 18 (5%) Bronx 154 (45%) Brooklyn 94 (27%) Manhattan 74 (22%) Queens 2 (0.6%) Staten Island | 16 (6%) The Bronx 126 (45%) Brooklyn 70 (25%) Manhattan 66 (24%) Queens 1 (0.4%) Staten Island |
| # Non-US Countries | 0.5% (2) | 2 (0.6%) |
Stay in touch
- Watch the event recordings and subscribe to our Youtube Channel for updates.
- Check out the Daily Scoop emails sent during Open Data Week for more highlights and information.
- Subscribe to The Message, BetaNYC’s monthly civic tech newsletter and submit your announcements.
- Chat with us on Slack and in our NYC Civic Technology, Design & Open Government Facebook Group.
- Stay tuned to upcoming events on our Meetup page.
- Follow us on Twitter: @BetaNYC @NYCAnalytics @NYCOfficeofTech @DataXDesign #opendata