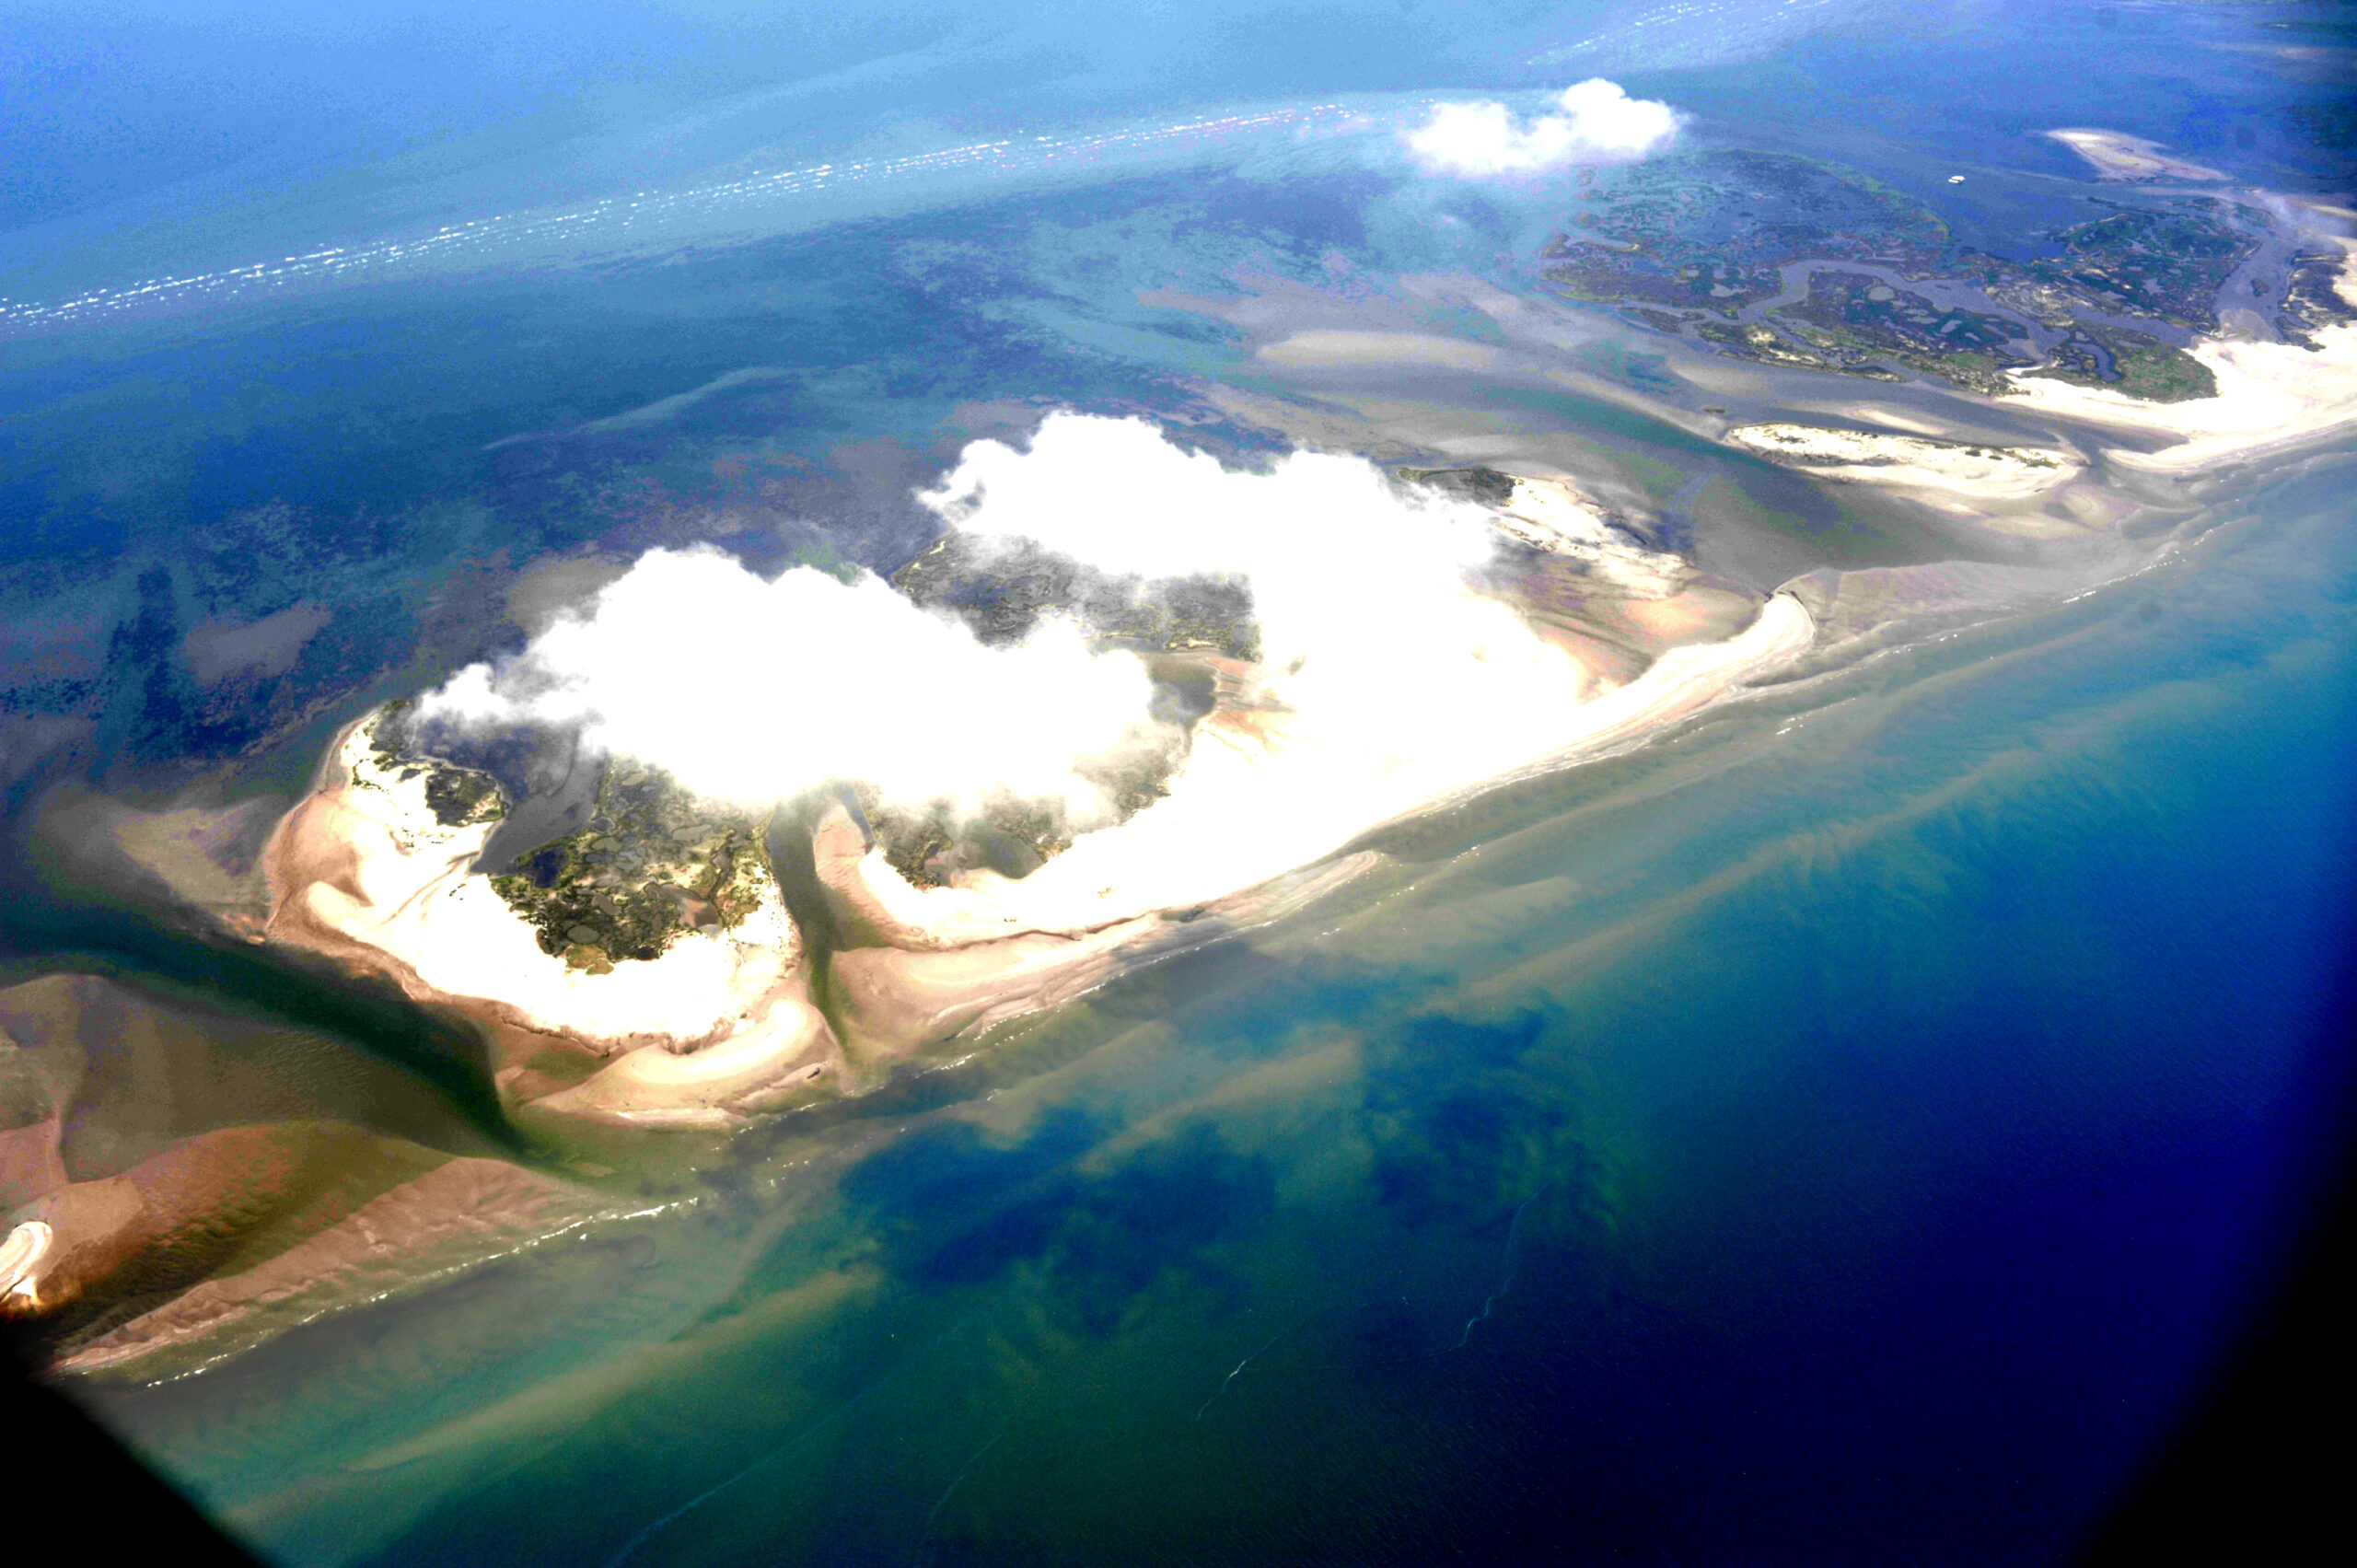
**Banner photo is an aerial image of the Chandeleur Islands, Louisiana, captured during the Grassroots Mapping project by the Public Laboratory for Open Technology and Science. This participatory research effort empowers communities to document environmental disasters, like the BP oil spill, and advocate for justice and accountability through mapping.**
Maps have always been at the heart of our mission, serving as tools to empower communities, guide policy, and advocate for social justice. This month, we’re thrilled to celebrate GIS Day (today, November 20th)—a global recognition of the power of geography and its ability to shape our understanding of the world.
At BetaNYC, we know that maps are more than visuals—they’re powerful tools to drive change, amplify voices, and inform decisions. Geographic Information Systems (GIS) plays a pivotal role in fueling open-source mapping platforms and data visualizations that drive advocacy and change, making today a celebration of the transformative potential of the geospatial technology that enriches our community’s work.
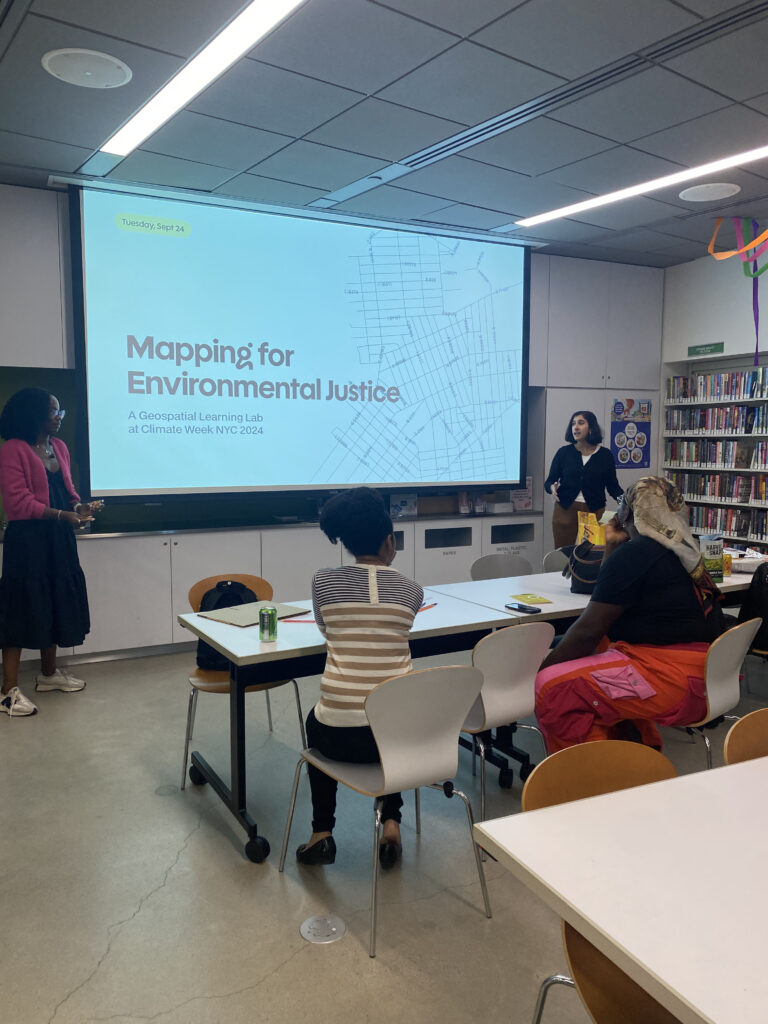
In September, I had the privilege of attending a dynamic event, Mapping for Environmental Justice: A Geospatial Learning Lab, hosted by Earth Hacks and trubel&co., and led by Nick Okafor (he/him), Sanjana Paul (she/her), and Arpan Somani (he/him). This workshop brought together young activists, environmentalists, and data enthusiasts for an immersive journey into how GIS and data visualization can be catalysts for environmental equity.

As an environmental science graduate, I found this event to be an incredible experience. The workshop provided space that felt both like home (with plenty of snacks!) and a place to grow. Attendees’ backgrounds, spanned academia, activism, as well as government, and this diversity made the workshop active and deeply engaging.
I interviewed the event organizers to capture their inspirations, takeaways, goals, and personal reflections. When asked about the inspiration behind the event, Nick shared, “We wanted to figure out how to provide this education around environmental justice, data mapping, and technology, and make it accessible for youth. The library provided a great opportunity to tap into existing infrastructure and ecosystems.” Arpan expanded on this vision, explaining, “We realized there weren’t many youth-focused events during Climate Week… I was directly inspired by my friend Cathy Richard’s guide to Navigating GIS. Her guide made it really easy to start understanding the landscape of GIS without having any formal training or knowledge about it. ”
The event emphasized our personal connections to place by first asking participants to draw maps of their homes. This exercise set the tone for the day, sparking conversations about memory, representation, and belonging. It also reminded me that mapping is inherently personal—a tool not only for advocacy, but also for storytelling. Many drew maps of New York City, while another person drew the island she hailed from. Sanjana drew herself walking her dog in her streetscape, expressing the moment she felt really at home.
The Power and Limitations of Maps
“You don’t need a PhD from MIT in data science to collect data, make maps and tell stories that are backed by quantitative and qualitative data. I want them to see themselves as having access to this tool, but then also being empowered to work together to tell those stories.” – Nick Okafor
From there we explored the history of GIS, its applications in environmental justice, and dove into real-world examples like NYC’s heat vulnerability and green space coverage, where environmental hazards directly affect community health. The workshop encouraged thinking critically about the power and limitations of maps. A discussion on the Mercator projection exposed how it distorts continent sizes, exaggerating regions like Europe and North America while minimizing Africa and South America—demonstrating the historically embedded biases maps can have.
Arpan illustrated this further with a “Google Maps hack,” where an artist faked a traffic jam using 99 smartphones in a wagon, tricking the app into displaying false congestion. This example underscored how maps and data, while impactful, can be manipulated, and reminds us to approach them with skepticism and care.
One of the most striking examples shared was the work of the Waorani people in the Ecuadorian Amazon, who used digital mapping to protect 1,800 square kilometers of their ancestral lands. This case underscored the potential of maps to elevate marginalized voices, allowing them to wield data as a shield against environmental exploitation.

Mastery Behind the (Workshop) Making
When asked why they chose these mapping examples, Arpan shared:
I wanted to showcase a variety of examples that challenge the general understanding of what a map is. By starting with this [Google Maps hack creating a fake traffic jam] example, we wanted workshop attendees to already be questioning the authority of conventional maps. And then by introducing the Waorani example…workshop attendees might be more open to re-thinking what “authority” means and who gets to decide what is true or not on a map. And finally, NYC Heat Story was chosen because we wanted something that felt close to home (literally), while still providing interactivity between qualitative and quantitative storytelling.
Reflecting on accessibility, Nick emphasized, “You don’t need a PhD from MIT in data science to collect data, make maps and tell stories that are backed by quantitative and qualitative data. And so I want them to see themselves as having access to this tool, but then also being empowered to work together to tell those stories.”
Telling the Fuller Story
As the workshop continued, we learned how environmental data is layered with spatial, temporal, and attribute information to tell a fuller story—capturing not only where pollution or green spaces exist, but also how they impact communities over time. The workshop highlighted how maps and data can make policy change more tangible and transparent, bridging the gap between lived experiences and the decision-making processes that often feel opaque and inaccessible.

Nick explained:
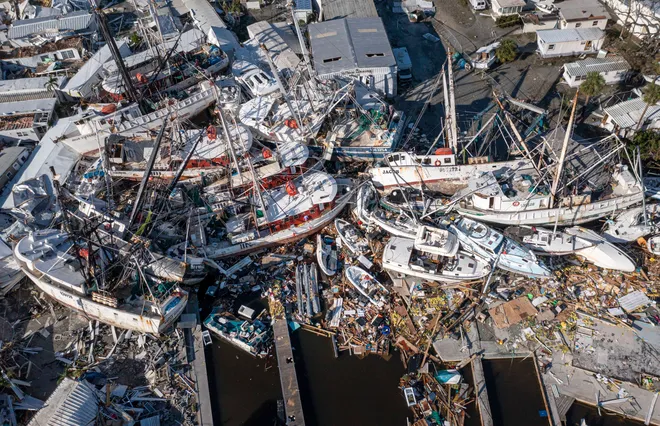
Southwest Florida was just hit by this hurricane, and we came in months later, able to provide this program, and it really evolved into being a space of really critical civic discourse. 16 year-olds are experiencing this live, but they don’t have the space in their classrooms to always talk about it or to think through like ‘what’s happening in my neighborhood’ … we created an opportunity for students to learn technical skills. And so we hope that by creating these localized investigators of community data, people who can tell these stories that will then be brought to policy makers, that will be brought to these community meetings, and we can really empower those who care about their communities to use maps and data to further strengthen the work that they’re already doing.
We concluded the workshop with a hands-on GIS exercise, where participants explored mapping software and data while reflecting on environmental issues they wanted to address. In that room at the Greenpoint Library, a small but powerful community of environmental activists came together—now equipped with knowledge, stories, and tools to champion equity and justice.
“Sometimes maybe your goal is not policy change with this specific project, it’s actually activating community consciousness right to eventually get to a level of policy change.” – Arpan Somani
Workshops like these, held in humble, communal spaces, remind us that real change begins with shared resources, collaborative learning, and collective action. Change happens when we uncover and amplify the stories often erased from history, when we draw maps and connections together, and when we remind one another, *Yes, we can do this.*
Real change can seem so large and difficult to tackle. In talking about inaccessibility, Sanjana added, “There is a legitimate information deficit sometimes between the people who are experiencing those impacts and the people who are deciding whether or not those impacts get to happen.”
Arpan followed, “It’s helpful to know what you’re trying to accomplish to reduce that gap. And sometimes maybe your goal is not policy change with this specific project, it’s actually activating community consciousness right to eventually get to a level of policy change.”
Whether it’s creating a map or sparking systemic change, we build equity step by step—together. I want to continue to uplift and amplify workshops like this, ensuring the many communities we are a part of have access to spaces where they can not only seek knowledge but also share their voices.
