Virtual Sessions – NYC Open Data Journeys

About:

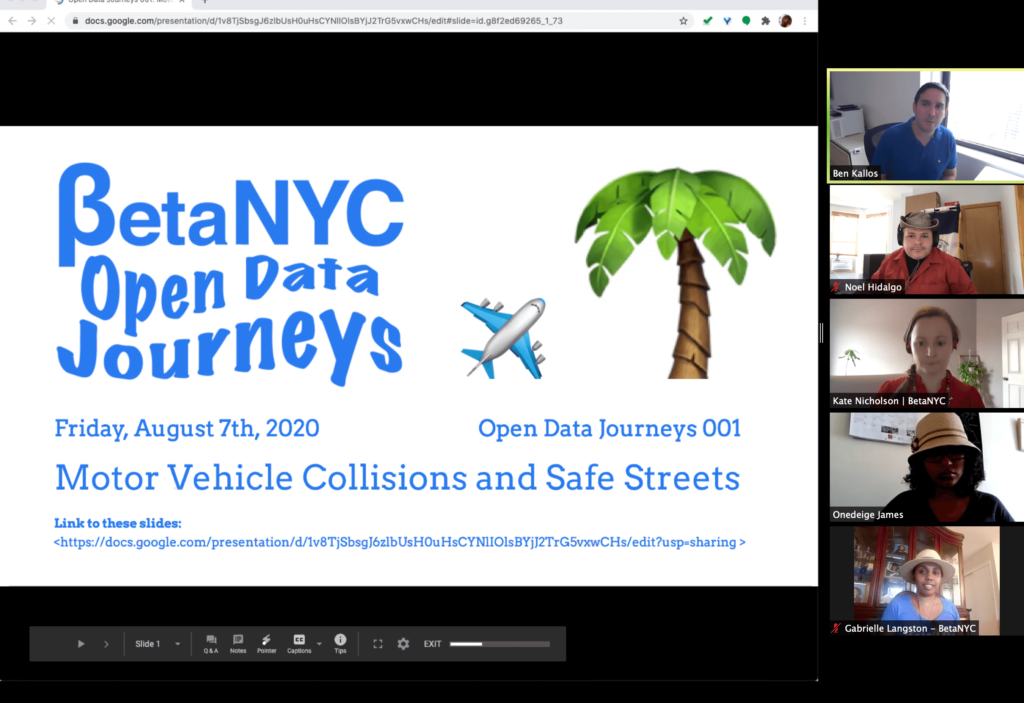
Explore open data and civic technology with BetaNYC. Open Data Journeys are virtual sessions that demonstrate how you can use publicly accessible datasets and tools to gain insight into your community.

THIS IS OUR DATA. THIS IS HOW YOU USE IT.
In each journey, BetaNYC Civic Innovation Fellows and Apprentices will pose a topic question and take you on a step-by-step investigation to answer it. You will gain insight into a process of accessing, cleaning, and manipulating data, and become acquainted with a set of tools to conduct an analysis. At the end of each journey, we will hold a brief Q&A.

A screenshot of the zoom meeting of our Open Data Journey 1
Our first open data journey introduced by CM Ben Kallos

Classes

Worksheet

Attend our Classes

If you are interested in attending these classes, we offer them on a monthly basis via our Meetup at https://meetup.com/betanyc.

Supporters

Many thanks to the generous support of the NYC Mayor’s Office of Data Analytics, Alfred P. Sloan Foundation, Manhattan Borough President Gale A. Brewer, NYC 311, Microsoft, Socrata, and ESRI.

Copyright

All content is copyright BetaNYC, a project partner of the Fund for the City of New York, and is licensed under Creative Commons Attribution-ShareAlike 4.0 International (CC BY-SA 4.0).

Partner with us

If you are interested in creating a new journey partner with us at radar@beta.nyc.


Journeys:

Journey 1: Motor Vehicle Collisions and Safe Street

In this Open Data Journey, we use NYC Department of Transportation’s Vision Zero View and CHEKPEDS’ Crashmapper to view real time motor vehicle driver, bicyclist, and pedestrian crash, injury and fatality data. We investigate a dangerous intersection in NYC and use BetaNYC’s BoardStat to learn more about it, like whether or not folks have used NYC 311 to alert the City about unsafe conditions there.

Slides: https://docs.google.com/presentation/d/1v8TjSbsgJ6zlbUsH0uHsCYNlIOlsBYjJ2TrG5vxwCHs

Journey 002: Noisy Neighborhoods

In this journey, we will investigate noise in two NYC neighborhoods. We will show you how to use several tools (BoardStat, SLAM, ) to generate insight about noise hot spots, associated commercial and street activity.

Slides: https://docs.google.com/presentation/d/1Ah9OV10DvncT03sR8M60t82Vf3j9FjnBHCK8qsQ2JGw

Journey 003: Housing & Displacement

In this open data journey we connect housing problems as registered in 311, to de-regulation and displacement risk. Historically, limited heat and hot water service has been a significant issue for tenants in low income and rent stabilized neighborhoods in the winter months. Now with exacerbated situations for all due to COVID19, can we use data to stay on top of this issue and help ensure that tenants remain safe this winter?

Slides: https://docs.google.com/presentation/d/1QdMUOspsoDYKppyuAnDM8Q0uPSEiqQzjloNUGa4A5CU