Executive Summary
Rationale for Research
[perfectpullquote align=”right” bordertop=”false” cite=”” link=”” color=”” class=”” size=””]”Anecdotal evidence … is one thing, but I’m a really strong believer in that that needs to be substantiated and backed up with quantitative data to make it real.”- Diana Switaj, Director of Land Use and Planning, Manhattan Community Board 1[/perfectpullquote]
New York City’s 59 community boards are responsible for representing the needs of local communities in city planning and budgeting. Composed of 50 appointed volunteers that live or work within the community, community boards have local expertise that enables them to advocate on behalf of their communities. They are the most local level of NYC government. For the past several months, BetaNYC has been conducting research on community board information infrastructure because we believe that boards should have the resources they need to represent the diverse and, at times, underrepresented needs in their communities and to legitimize issues that they already know to impact their communities. BetaNYC has placed community boards at the center of our research because we believe that their experience living and working within their communities uniquely positions them to connect with citizens, to understand local problems, and to audit biases in data.
BetaNYC is committed to conducting research, producing recommendations, and designing tools that are responsive to the politics of data production and consumption — not assuming that technology fixes are always the most appropriate for addressing community needs or that numbers alone can represent complex problems. We are committed to advancing community boards’ data literacy skills, not only so that they can leverage these resources on their own, but also so that they can better anticipate and respond to the ways in which data practices can be used to marginalize their neighborhoods and constituents. We believe that community boards should be equipped with the tools to balance the stories that powerful actors tell with data and to anticipate the consequences of new datasets being made publicly available and new data systems being put in place. We are committed to advancing not just data accessibility but also data justice and equity.
Methods
BetaNYC conducted 12 interviews with community board staff in Manhattan and Brooklyn, seeking to better understand their information workflows, frustrations, current technical capacity, and what they hoped to see improved. We also reviewed the 2017 district needs statements for all community boards city-wide, attended several community board meetings, and conducted a city-wide survey to learn more about community board data success stories and needs.
Current Workflows
Currently, community boards across the City leverage open data resources to different extents and in different capacities. Several boards leverage demographic data in order to understand how planning initiatives may disproportionately impact certain communities. Some boards also reference data about requests for agency service (for issues such as noise, odors, and broken infrastructure) to legitimate the prevalence of concerns in their communities, investigate potentially illegal behavior, and triage budget items. Finally, they often reference historical and anecdotal information to contextualize issues that come before their boards.
Challenges
While many of the boards BetaNYC interviewed outlined specific use cases for which the board would like to leverage city and state data resources, they also acknowledged the challenges to doing so. Sometimes, the data they wish to leverage has not been published by the City, is not up-to-date, or is categorized in a way that makes it irrelevant to addressing their issue. At other times, community boards do not have the time, skills, or technical infrastructure to work with data resources effectively. Boards are also concerned that ignoring biases in city and state datasets will lead them to overlook certain community issues, misrepresent marginalized populations, or propagate a culture of surveillance.
Use Cases
Through our research, BetaNYC identified a number of scenarios where community boards could benefit from more accessible, more comprehensive, and/or more interactive city and state datasets and tools.
- Community boards would like access to data about the number and saturation of vacant storefronts in their districts — a dataset that the City currently does not produce so that they can advocate for sensible rent regulation.
- Community boards would like to be able to aggregate data about liquor-licensed establishments in order to speed up the process of reviewing license applications.
- Community boards would like to have more accessible data about the number of after-hours construction permits awarded in their districts so they can help the Department of Buildings (DOB) audit applications.
- Community boards would like data about the number and location of rent-stabilized buildings in their districts so that they can provide better oversight of potential tenant harassment.
- Community boards would like more timely data about street closures so they can communicate to their constituents when transportation and parking will be affected.
- Community boards would like more information about the number of sanitation workers in their districts and the frequency of collection so that they can advocate for more resources in writing district budget requests.
In this report, we outline opportunities for improving city data resources to address these information needs.
Recommendations
| Community Boards | Civic Tech Community |
|
|
| City Agencies | Elected Officials |
|
|
Background
About NYC Community Boards
New York City community boards play an important intermediary role between city government and local communities. Community boards have their origins in the 1950s at a time when there had been calls to incorporate more citizen input into city government operations.[1] Then Manhattan Borough President Robert Wagner established 12 community planning councils (composed of 15-20 community members) to advise the Borough President’s Office on issues around planning and budgeting. With a NYC Charter Revision in 1963, community planning councils were established in all five boroughs, and with a Charter Revision in 1975, they were given formal responsibilities to review land use proposals and to participate in the city’s budgeting process.
Today, NYC’s 59 community boards each represent a community district (or a subdivision of one of the City’s five boroughs). Each board is made up of 50 volunteer members that live, work, or have some significant interest within the district. Community board members meet several nights a month to deliberate around issues in their community and produce advisory resolutions to city and state departments and offices. As the most local city government entity, community boards aim to balance neighborhood concerns against the push for more city development. They are specifically tasked with reviewing and producing recommendations on whether to approve, amend, or reject land use and zoning applications, as well as various license applications (including liquor licenses and sidewalk cafe licenses). These recommendations are then passed on to city and state departments and offices that decide whether to follow the community board’s recommendation. Reviewing such applications is a time-intensive task for community boards. Most boards receive several applications per month and, for each, they need to review hefty application packets and hold public hearings to gather feedback from the public. City and state policies delimit the timeframe they are allotted for producing a recommendation.
Community boards also participate in the City’s budgeting process, helping to identify budgetary needs in their communities by drafting a lengthy annual district needs statement that outlines the top issues facing their districts around affording housing, health and social services, education and youth, sanitation, transportation, and public safety. Each year, they consult with city agencies to prioritize these needs.[2]
Much of the community board’s work is organized and managed by board committees; for example, many boards will have separate committees to focus on issues around land use, licensing, transportation, health and human services, and economic development. Some other common issues that community boards address include:
- Monitoring complaints in their district about noise, potholes, illegal construction activity, and tenant harassment, and liaising with city agencies and elected officials to ensure these issues are addressed;
- Working with city agencies to communicate community concerns about impending transportation shutdowns, as well as the introduction of new shelters, clinics, and sanitation garages in their districts.
- Advocating to elected officials and planning agencies on behalf of their communities for more park space, school desks, public trash cans, and accessible infrastructure;
- Writing resolutions in support of or against impending city legislation around issues such as affordable housing and retail diversity;
- Tracking community events, construction activity, and street closures, and sharing this information with constituents.
Most community boards have a district office, which is run by a district manager and a few additional paid staff members. In most district offices, staff are responsible for implementing community board policies, liaising between the board and city and state department offices, filing paperwork for each resolution, fielding complaints from the community, scheduling board meetings, and disseminating information to the public. In many cases, district offices will help community board committees track down information that they need in order to assemble a resolution or a report.
Community board members are not elected, but instead get appointed by the President of the Borough in which the community district resides. Half of appointees are selected based on nominations from City Council, and half are drawn from applications. There are no term limits for community board members (an issue that is currently being debated),[3] and there have been growing concerns that the appointment process does not ensure that the board’s composition will reflect the diversity of the community and that appointments may serve political interests. There are also concerns that, because the community board’s role is purely advisory, their input does not always translate into power. Even when community boards express strong opposition to certain proposals (around land use, licensing, or budgeting), the City Council, City Planning Commission, or various State authorities can still pass the proposals, and community boards cannot veto these decisions.[4]
Because community boards are limited in their ability to impact city decisions, it is important for them to have access to information that can serve as evidence for claims they make in resolutions and district needs statements. However, community boards, while technically a city government entity, are often overlooked and underserved by the various city agencies that are responsible for producing and managing city information resources. Borough Presidents are charter-mandated to provide community boards with “technical support,” but this is often interpreted as providing urban planning or legal expertise. This is why BetaNYC has made supporting the technical and information infrastructure a top priority in our work.
About BetaNYC
BetaNYC[5] is a community-based organization dedicated to improving lives in New York through civic design, technology, and data. In 2014, the community wrote the People’s Roadmap to a Digital New York City[6] which outlined our values, vision, and 34 goals — a few of those ideas have turned into the Civic Innovation Lab & Fellowship. Now, we work in partnership with Manhattan Borough President Gale A. Brewer, the Mayor’s Office of Data Analytics (MODA), City University of New York’s Service Corps program, and the Fund for the City of New York (FCNY) to address Manhattan Community Boards’ technology, data, and digital literacy needs. To date, the program has developed BoardStat[7] (a NYC 311 dashboard built with Community Boards for Community Boards), SLA Mapper (a tool for aggregating information about liquor licenses), Tenants Map (a map to highlight housing-related complaints in buildings with rent-stabilized units), the City’s first freely available — openly licensed open data curriculum, conducted a detailed technology census of District Offices, and is working with Department of Information Technology and Telecommunications (DoITT) to help modernize Community Board websites.
In order to better support community boards’ specific, contextualized information needs, we have been conducting research into community board workflows — seeking to better understand the need for data literacy amongst community board members and district offices and how community boards are/should be using city and state open data resources to advance their work.
Research Design
Issues and Rationale: Why did we do the research?
Saving Community Boards Time and Resources
Community board members are appointed volunteers — often balancing their membership with daytime commitments. District office staff are also strapped for time, having to make the most of tight resources to get through day-to-day operations such as scheduling, application paperwork, and fielding and resolving concerns from the community. At times boards struggle just to read through the materials in the applications they receive, let alone follow-up on those applications with additional research. As Angel Mescain, District Manager of Community Board 11, described to BetaNYC in an interview:
I think the challenge for board members is that the amount of information that at times they’re asked to digest can be overwhelming. For example, Land Use applications and BSA applications, there’s those kinds of things, where it’s reams and reams of paper that are shared with us by applicants and by the corresponding agencies that we then share with our members, oftentimes are 5-10 inches thick and are just too much for the members to digest. They’re volunteers. The level of expertise or exposure to the subject matter contained within the applications can often be outside of their understanding or not what they’re working on regularly. And the amount of time that they are able to commit to reviewing the documents I think is limited by the amount of time they are willing to give to the community board work from their own personal time. So I think that becomes a challenge for them.
Further, oftentimes accessing relevant information sources can be a complex, multi-step process. Different city and state agencies maintain their data in different locations and in different formats, so to access that data in ways that are supportive to their workflows, community board members and district office staff need to learn how to navigate and parse multiple systems. This is a task many boards and offices do not have the time and resources to do. BetaNYC aims to design information tools that aggregate data sources relevant to a particular workflow into a unified view, consolidating the number of information sources boards need to access to contextualize an issue and the number of steps they need to take to draw meaningful insights from the data.
Supporting Community Boards in Representing Diverse Community Needs
Community board members face enormous challenges when it comes to making informed decisions about their communities. While those appointing members to boards often do their best to ensure that the board’s composition reflects the diversity of the community, it can be difficult to ensure that marginal community voices have a say in decision-making. Boards can elicit feedback from their communities, but as BetaNYC has learned through our research, many boards are concerned that the loudest constituents in their communities will drown out the voices of others. This makes it difficult for community boards to advance decisions based on the broader community’s needs rather than the needs of select individuals or groups (see Figure 1).
Figure 1: Contexts Impacting Community Boards’ Abilities to Represent Diverse Community Needs |
||
Value Proposition |
What enables community boards to achieve this? |
What contexts corrode community boards’ ability to achieve this? |
|
1. A community board’s composition should reflect the diversity of the community. |
Community board application process is designed to enlist diverse membership to the Board. | Only a certain segment of the population applies to be on community boards. Only certain segments of the population are able to serve on community boards (e.g. difficult for single parents and those working multiple jobs). Some community board members are appointed for political reasons. |
| 2. Community boards should elicit diverse input from community members. | Community members can attend and speak at community board meetings. Some boards appoint public members to committees. | Sometimes, due to timing constraints, public comment will happen late in a review process or even after a vote. Community board members suggest that only the loudest voices in their community actually speak at meetings and that these voices are sometimes not representative of the wants of the community as a whole. |
| 3. Community boards should consider the specific social and historical contexts of their district when advancing decisions. | Many community boards have members that have lived in the community and/or been on the board for a long time. These members not only have a deep understanding of the social and historical context of their district, but they also have the institutional knowledge of positions the board has taken in the past, which can act as frameworks for positions that they take today. | Some suggest that these legacy positions are outdated and don’t factor in new city conditions. Some argue that there should be term limits for community board members to ensure that there are opportunities to diversify the board’s composition. |
| 4. Community boards should proactively seek to incorporate marginal voices. | Community boards can reach out directly to impacted constituents. |
There’s often not enough time in the decision-making process to reach out directly to impacted constituents. |
[perfectpullquote align=”right” bordertop=”false” cite=”” link=”” color=”” class=”” size=””]This is a long-standing problem of representational democracy and can’t be solved simply by throwing more information into the mix.[/perfectpullquote]
This is a long-standing challenge of representational democracy and cannot be solved by simply throwing more information into the mix. However, BetaNYC does believe that making more diverse information sources accessible to community boards can help them look at an issue from additional angles — perhaps offering them a lens that they had not considered before. While certainly some data resources overlook problems faced by marginalized populations, other data resources can highlight them. [perfectpullquote align=”left” bordertop=”false” cite=”” link=”” color=”” class=”” size=””]BetaNYC aims to document opportunities for designing information tools that configure city and state datasets into visualizations that boards can reference to extend their understanding of a community issue. We also aim to design data literacy training that can help them discern what data highlights, what it eclipses, and how the politics of its production implicates this.[/perfectpullquote]
For instance, researchers have argued that Street Bump — a mobile application that alerts Boston officials of potholes — tends to eclipse communities where mobile phone ownership is low.[8] However, research has also shown how the publication of certain data resources has rendered visible communities facing inequitable burdens. For instance, since the late 1980s, researchers and activists have leveraged the US Environmental Protection Agency’s Toxic Release Inventory — a dataset documenting the amount and location of toxic chemicals annually released by industrial facilities — to highlight communities disproportionately impacted by environmental stressors.[9] BetaNYC aims to document opportunities for designing information tools that configure city and state datasets into visualizations that boards can reference to extend their understanding of a community issue. We also aim to design data literacy training that can help them discern what data highlights, what it eclipses, and how the politics of its production implicates this.
Helping Community Boards Legitimize Known Issues
More often than not, community board members know the major concerns in their communities and do not need data to identify those concerns. However, it can at times be difficult to advocate for those concerns to their constituents, developers, and city officials without data to back them up. For instance, as Diana Switaj, Director of Planning and Land Use for Community Board 1, described in an interview with BetaNYC:
Anecdotal evidence … is one thing but I’m a really strong believer in that that needs to be substantiated and backed up with quantitative data to make it real. Because you can say all day long, we’ve had more and more residential development, but it’s typically not until you document that, and you can show it on a map or a chart, that that really sinks in with people, and it really doesn’t have any teeth until you back that up with data. So when we bring that — when we draft our recommendation on an application, you really get the complete picture when you are able to say, “Residents came out; they said this. When we did our research, we found that 7 gyms were added to this data over a 5 year span and in that time 311 complaints on noise increased 1000%.”
BetaNYC aims to document opportunities for designing tools that display statistics community boards can reference when they need to explain issues to their constituents, challenge a developer or license applicant, or make a case for or against a particular proposal.
In doing so, we aim to accentuate potential biases in the data, rather than burying them under layers of visualization. In March 2003, New York City opened a 311 Call Center, tasked with fielding calls made to 311 from city residents about non-emergency-related issues such as noise, potholes, missing street signs, and housing issues. In October 2010, NYC311 began publishing all anonymous service requests as open data. As of August 2018, 311 has over 18 million rows of data, recording service requests spanning back to 2010. Representing quality of life concerns throughout the City, the 311 service request dataset is perhaps the most important dataset to community boards; however, it also only records issues when New Yorkers call about them and thus is not representative of the diverse issues facing a community district. BetaNYC is committed to helping community boards sort through these limitations and biases when leveraging 311 to legitimize known issues.
Empowering Community Boards to Challenge Data
Having access to data and the ability to interpret, analyze, and visualize it is a form of power.[10] Recent research on the politics and practices of big data has shown how, throughout history, data has been used as a tool to surveil and further marginalize already disempowered communities.[11] For example, in the mid-twentieth century, demographic data was used to identify communities with underrepresented populations and segregate them from having access to lending and insurance — a practice known as “redlining.” Today, powerful stakeholders have championed data collection practices and algorithmic decision-making practices that have been shown to harm marginalized groups — such as census policies that target immigrant communities,[12] social service eligibility algorithms that withhold services from the poor,[13] and predictive policing algorithms that profile communities of color.[14] The City’s open data resources can be used in similar problematic ways. Corporations looking to set up new locations can leverage open city data to highlight and avoid areas where crime and poverty is high, diverting jobs and economic resources away from communities that need it most. On the other hand, developers and financiers may use open city data to discern communities where rents are beginning to rise so they can purchase and transform properties in these areas into luxury apartments, pricing low-income communities out of their housing.
[perfectpullquote align=”left” bordertop=”false” cite=”” link=”” color=”” class=”” size=””]BetaNYC believes community boards should have: 1) Community-based data tools to balance the stories of powerful actor, 2) Data literacy, 3) Insight into the ways data can disempower communities, 4) Outlets for community members to tell their stories[/perfectpullquote]
BetaNYC is committed to advancing community boards’ data literacy skills, not only so that they can perform their own data analysis, but also so that they can better understand the ways in which data practices can be used to marginalize their neighborhoods and communities. We believe that community boards should be equipped with the tools to balance the stories that powerful actors tell with data and to anticipate the consequences of new datasets being made publicly available and new data systems being put in place. We are committed to advancing not just data accessibility but also data justice and equity.[15]
Aims and Questions: What did we aim to learn from the research?
[perfectpullquote align=”right” bordertop=”false” cite=”” link=”” color=”” class=”” size=””]…we conducted this workflow research to better understand the information infrastructure supporting community board work so that we could collaborate with boards to build upon and improve it in strategic and equitable ways.[/perfectpullquote] BetaNYC conducted research into community board workflows — aiming 1) to understand what types of information community board members and district office staff need to advance their work, 2) to characterize the expertise and infrastructure that can support them in acquiring this information, and 3) to document the challenges they face in accessing, analyzing, and sharing this information. BetaNYC is committed to ensuring that any recommendations we propose align with current board workflows, address specific information needs, are sensitive to the organizational constraints placed on board members and district office staff, and consider the ethical and political implications of modernizing information practices. In other words, BetaNYC conducted this workflow research to better understand the information infrastructure supporting community board work so that we could collaborate with boards to build upon and improve it in strategic and equitable ways. In doing so, we learned just how well-positioned community boards are to highlight opportunities for improving information infrastructure throughout the City.
Commitments: What commitments guided research design?
Community boards are tasked with representing the needs of their communities in government decision-making. They are the most local government body in NYC, and because of this, they are particularly well-positioned to address local community challenges and advocate for solutions. Community boards need to be armed with information about their communities and about city processes and resources to do this well, and this report identifies opportunities for improving the accessibility of information. However, the report also demonstrates why and how the unique positioning of community boards makes them ideal collaborators in improving city data governance.
For community boards, what it means to make “informed” decisions often (and for good reason) involves much more than referencing statistics. For instance, community boards make decisions based on the types of concerns community members voice during a committee meeting. They make decisions based on their own or the board’s anecdotal knowledge of a community district’s history. Diana Switaj, Director of Planning and Land Use for Community Board 1, noted during our interview:
You know, also [committee members] are really specialized in the fact that they live in those areas, and they have the institutional history of being on the board long enough that they remember everything that happened there before, or have been in the area long enough to … really report on things that have happened in the past, and that’s often more important than the input of technical expertise, or expertise of an architect, or whatever it may be.
In other words, many community boards inform their decisions with historical and anecdotal data — information that they collect from their community or that they recollect from their experience living or working in the community. Informing community board decisions and work with this type of data is important; it enables boards and district offices to robustly characterize the diverse, complex, and sometimes underrepresented needs of their communities. For instance, Susan Stetzer, District Manager of Manhattan Community Board 3, emphasized the importance of being able to tell detailed stories when putting together resolutions and district needs statements. Speaking of the format of her board’s district needs statement, she described:
We last year started doing something new in Health and Human Services; it was the idea of my assistant district manager at the time. There are certain kinds of things that you can’t really talk about in the normal flow of the district needs. So we did a call-out … on students with special needs, learning disabilities, and homeless students. And these are … heart-wrenching. So instead of just having a paragraph talking about it [in the district needs statement], we had a panel and people talking about these issues, and then we did a call-out. You know a story. … And … this year we’re doing it with healthcare facilities. You have sick people with ceilings falling in around them — that kind of horrible details.
She continued, “We need to tell our story,” and noted that many of the most important stories they need to tell do not fit into statistics.
BetaNYC is committed to building data tools within government that supplement (not supplant) historical and anecdotal data because we believe that amongst all of the stakeholders formally involved in city planning processes, through their knowledge of their communities and community feedback, community boards are the most uniquely positioned to characterize what the numbers do not or cannot show.
[perfectpullquote align=”left” bordertop=”false” cite=”” link=”” color=”” class=”” size=””]…community boards can draw attention to issues that may be eclipsed by statistics currently produced by and about the City.[/perfectpullquote]First of all, community boards are uniquely positioned to fill in data gaps; they are uniquely positioned to characterize and report problems in instances where there are no formal processes for the City to collect information on and track those problems. In this sense, community boards can draw attention to issues that may be eclipsed by statistics currently produced by and about the City. For instance, community boards are often the first City entity to know about sidewalk accessibility issues, tenant harassment issues, and problems with local businesses because folks in their communities have an outlet to share their stories. Second, community boards are perhaps the best auditors of data because they know their communities well enough to know when something looks off in a dataset or a data visualization.
Community boards have this unique positioning because they have access to other more situated and richly contextualized forms of data about their community — historical data, community voices, and ethnographic data. Community board members and staff can serve as allies in data quality improvements[16] and can help identify information that should be available but currently isn’t.[17] This report aims to highlight why community board voices are vital to include in conversations around improving the City’s open data resources, and it offers practical recommendations for making this happen.
Methodology: How did we conduct the research?
While BetaNYC has been researching community board workflows and data infrastructure for several years, a grant from the Alfred P. Sloan Foundation allowed us to focus on gathering empirical material for this report beginning in March 2018. Over a four-month period, BetaNYC has conducted informational interviews with 10 of Manhattan’s community board district managers. In a few cases, the meetings also included assistant district managers, community associates, and land use specialists. We honed in on Manhattan early on because we had support from Manhattan Borough President, Gale A. Brewer, a champion of the City’s Open Data Law. Through support from her office, we were able to connect with Manhattan community boards and build relationships with their district offices. As the research gained momentum, we had an opportunity to connect with a few Brooklyn community boards that leverage open data often in their district offices. This enabled us to also conduct interviews with the district managers for Brooklyn Community Boards 10 and 14. We recognize that, stemming primarily from Manhattan and Brooklyn, the report will have a bias towards particular challenges and use cases that may not represent the information infrastructure contexts for every board in the City. As we begin to scaffold relationships with district offices throughout the City, we hope to continue the research beyond this report and work to eventually characterize the unique challenges faced in other Boroughs.
Interviews were conducted in a semi-structured manner. While in every case we had a list of questions prepared ahead of time, we also allowed the conversation to diverge from these questions in response to anecdotes, ideas, and issues that interviewees brought up during the interview. We chose to conduct interviews this way for a few different reasons. First, community boards across the City are quite diverse in terms of their relationship to their district office, their workflows, and their capacity/inclination to use open data in their work. When interviewing boards that are already using open data in their work, the interview tended to focus more on the circumstances for which they accessed the data and the challenges they faced in doing so. When interviewing boards that hadn’t thought much about using open data in their work, the interview tended to focus more on discussing the most prominent concerns that come before the board, the time-consuming parts of committee work, and how board members go about representing the diverse needs of their communities. We needed to design flexibility into our interviews in order to account for these diverse contexts. Second, since our aim is to design advocacy, curriculum, and tools that respond to the needs of community boards, it was important for us to provide space for district managers to direct the conversation according their information needs and challenges — sometimes in ways we did not anticipate when designing the interview questions. We did not want to assume to know what the most prominent issues and concerns would be ahead of time, but instead to structure a conversation so that district managers could direct us towards their primary information and data challenges. In most cases, the interview was recorded and fully transcribed.
BetaNYC also examined the most recent district needs statement for every community board in the City. We did so, not only to better understand the needs of each community district, but also to better understand which sources community boards tend to cite when making claims about their communities and around which issues they suggest needing further data/information. We observed several community board committee meetings (including land use meetings, economic development meetings, and licensing meetings), noting the processes by which committee members collected and referenced information about an issue, assessed the community’s concerns, and deliberated towards a resolution.
Finally, we devised a very short survey for all community board members across the City, requesting 1) an example of a scenario where they successfully used the City’s open data to address issues that came before their board, and 2) an example of a scenario where they felt that they needed better access to city data to address an issue that came before their board. We sent both digital and print versions of the survey to all 59 community district offices in the City, requesting that each office forward it to their Board members. We received 26 responses (representing 13 distinct boards) from board members and district office staff in Manhattan, Brooklyn, Queens, and the Bronx (See Appendix II).. The report outlines the findings of this research.
Feedback: How did we vet the research?
Prior to publication, BetaNYC invited a series of leaders from community boards, city agencies, civic technology organizations, and data advocacy groups to offer their expert feedback on this report. The following individuals reviewed the report:
- Anonymous Reviewer
- Cynthia Conti-Cook, Staff Attorney at Special Litigations Unit at the Legal Aid Society
- Lilian Coral, Director of National Strategy for Tech Innovation at the Knight Foundation and Former Chief Data Officer for the City of Los Angeles
- Lucian Reynolds, District Manager of Manhattan Community Board 1
- Adrienne Schmoeker, Director of Civic Engagement and Strategy at the Mayor’s Office of Data Analytics
- Matt Stempeck, Corporate Overlord at the Bad Idea Factory, Former Director of Civic Technology at Microsoft, and Advisory Board for BetaNYC
- Andrew Young, Knowledge Director at GovLab
We asked these reviewers to respond to the following questions:
- Does the report effectively portray the contexts, challenges, and opportunities for improving community board information infrastructure?
- Does the report fairly and robustly present empirical content to back up its claims?
- Is the report attentive to the social, political, and ethical contexts of data access and use?
- Are the recommendations presented appropriate for addressing the issues described throughout the report? Are they useful?
- Is the report accessible to diverse audiences?
- Other comments
Their feedback helped us to clarify the arguments, improve the recommendations, and address issues we had not considered. We are incredibly grateful to have had their input.
Audience: Who do we hope will engage with the research?
Community Boards
This report will document how community boards throughout the City articulate their data needs, which can help members and district office staff discern what infrastructure they should advocate for. The report also offers practical recommendations to community boards for filling immediate needs.
Civic Technologists
This report outlines use cases for data and technology needs at the most local level of NYC government.
The report also offers background on some of the technical, organizational, political, and cultural factors that implicate how data is produced and consumed in NYC. Understanding this context can support civic technologists in promoting and designing technology solutions that are ethical, appropriate, and sustainable.
Staff Supporting Data Operations at City and State Agencies
The report identifies several areas where city and state agencies can improve data collection, management, and publication to better support the needs of the diverse stakeholders that will consume the data. The report concludes with recommendations for how city and state agencies can engage diverse data users when planning for data releases and designing dashboards for visualizing data.
NYC and NYS Elected Officials
The report highlights where additional budgetary resources are needed to support effective and efficient community board operations, to promote equitable open data governance, and to sustain representative democracy. The report also identifies pieces of legislation that could improve the City’s information infrastructure.
In addition to these primary audiences, BetaNYC hopes the report can:
- Inform academics and students seeking to better understand the open data and civic technology landscape in NYC,
- Profile the state of open data in NYC for the global and national civic technology community,
- Articulate specific data and technology challenges local government entities face for the technology in government research community
Defining Data
New York City’s Open Data Law[18] defines “data” as follows:
“Data” means final versions of statistical or factual information (1) in alphanumeric form reflected in a list, table, graph, chart or other non-narrative form, that can be digitally transmitted or processed; and (2) regularly created or maintained by or on behalf of and owned by an agency that records a measurement, transaction, or determination related to the mission of an agency.
It goes on to note that:
Such term shall not include information provided to an agency by other governmental entities, nor shall it include image files, such as designs, drawings, maps, photos, or scanned copies of original documents, provided that it shall include statistical or factual information about such image files and shall include geographic information system data.
The New York State (NYS) Executive Order, requiring state agencies to make their Publishable State data available online,[19] defines “data” almost identically to the City’s definition.
While these definitions are important for interpreting and enforcing open data requirements, when the authors refer to “data” throughout this report, we interpret the term more broadly. This is because (as we will show throughout the report) for many community boards, qualitative data is just as important to informed decision-making as quantitative data. Such qualitative data is often contained in image files or copies of original documents. We define data as any information gathered for the purposes of reference or analysis. Throughout this report, when we refer to “data” alone, we are referring to this broader sense of what counts as data. When we refer to “city and state data,” on the other hand, we are referring to the data that is governed by the City’s Open Data Law or the State’s Executive Order.
Current Community Board Information Workflows
In every board, data is referenced to a different extent, derived from different sources, and used in different capacities. All boards use different forms of historical and anecdotal data in their decision-making. The three most common forms of city and state data that boards currently reference in their work fall under three categories — 1) demographic data, 2) data reporting constituent complaints, and 3) data characterizing land use.
Demographic Data as an Analysis Tool
Boards and district offices analyze demographic data in order to better assess the demographic make-up of sub-neighborhoods in their districts. This enables them to monitor how changes in the City’s landscape (such as gentrification, rising costs of living, and a rapidly increasing residential population) will disproportionately impact certain communities. It also enables them to monitor which communities will be most dramatically impacted by certain city planning initiatives such as a rezoning, the temporary shutdown of transportation routes, or the establishment of a new homeless shelter.
For instance, in district needs statements, many community boards cited demographic data when describing the challenges their districts faced with a rising senior population. These numbers helped them advocate for funding more affordable senior services, more street furniture, and better oversight of potential landlord abuses in their district. They also cited demographic data reporting the number of school-aged children in the district when advocating for increasing the number of desks at schools.
To gather data about their community’s demographics, some boards reference census data directly from the American FactFinder website. Many boards look up demographic statistics on the Community Profiles[20] put out by the Department of City Planning (DCP). In general, boards speak highly of the DCP’s Community Profile tool. Josh Thompson, Assistant District Manager at Community Board 2, noted that the tool was “very impressive and pretty much already has all [census] data readily available.”
Diana Switaj at Community Board 1 noted that she often references data2go.nyc to gather information about demographics:
They use all kinds of different datasets for all different measures in NYC. We use that very often; it’s a really great go-to for us in terms of demographics. They have 311 statistics in there; that’s really useful.
Susan Stetzer at Community Board 3 noted that her board cites NYU Furman Center’s neighborhood profiles[21] more than anything else when producing Community Board 3’s district needs statement.
Community boards collect demographic data mostly for analysis purposes — to better understand the diverse needs in their communities and how decisions will affect certain groups more than others.
Complaint Data as a Legitimation Tool
In most of the interviews that BetaNYC conducted, district managers noted that they will look up the number of noise complaints made to 311 at a particular incident address when making decisions about land use or renewing a liquor license. In some cases, they will call the New York Police Department (NYPD) to ask the number of noise complaints made at a particular address. In other cases, they will access the City’s Open Data Platform, navigate to the 311 Service Requests from 2010 to Present dataset, use Socrata’s built-in features to filter the data to noise complaints, and search for the entries associated with the address of the proposed renewal. Susan Stetzer, District Manager of Community Board 3, noted that, not only the district office staff, but also her board members will look up this data when making a decision about a bar’s liquor license renewal:
…so if the business is coming, and they want to extend their hours, one of the board members will say, “In the last year, you have 50 something noise complaints and the police responded and found an action non-crime corrected this percentage of the time.”
Similarly, Diana Switaj, Director of Planning and Land Use at Community Board 1, described that she will check 311 noise complaints to substantiate concerns in her community about the proliferation of particular building uses, in conjunction with increases in noise complaints:
If … some kind of use is coming in to an area where there’s a lot of residences, and [the community] might say, “We’ve had so many of these uses coming in.” Say it’s a gym for instance, and they [say], “Hey, we’ve had a lot of gyms come into this area. People need to realize that people live here. There have been a lot of noise complaints.” I might 1) check the development history in that area to see how many gyms have been added, and 2) check 311 to cross check how many complaints we’ve had, and if that’s consistent with the gyms being added. So that gives you a general example of how we might use data.
Josephine Beckmann, District Manager of Brooklyn Community Board 10, described a time when she was able to leverage data about the number of 311 noise complaints made at a bar to justify holding a public hearing to address quality of life concerns. When a liquor license renewal for the bar came before her board, she queried the 311 dataset to see if any complaints had been made about the bar. She found that 115 complaints had been made. Based on her finding, she invited the residents within a certain perimeter of the bar to a Community Board 10 Committee meeting to discuss the issue with NYPD and the bar owner:
We reached out to neighbors and invited them to a Community Board Police and Public Safety Committee. It was well attended, and although the issue is not yet resolved, we were able to bring everyone together, and the neighbors had a voice. 311 service requests to the police department did not correct the problem, and neighbors were frustrated. There were 115 noise complaints in a 2-year time period, and the police response did not address their quality of life complaints. Residents were delighted that they were invited to the Community Board to meet with the Police Department and the owner of the establishment to work toward a resolution.
Anya Hoyer, a Community Coordinator at Brooklyn Community Board 14 described how her board will reference 311 data in their district needs statements to back-up concerns about the span of repair time for certain street conditions. Using Socrata, they will build maps that display 311 complaints about street conditions such as cave-ins and potholes and track how long complaints remain open. In these cases, having numbers to substantiate the community’s concerns about noise and agency response times has been useful in backing up issues they already know to be true.
Complaint Data as an Investigative Tool
In a few of the interviews BetaNYC conducted, we learned how district offices are using 311 data to investigate issues in their districts. The district offices for Brooklyn Community Boards 10 and 14 both described how they have used 311 data to track illegal conversions[22] in their districts. Within Socrata, they will create map visualizations that display all 311 complaints about illegal conversions, and they will use the map to pinpoint problem buildings in their districts. At times, they will compare these complaints to the calls they are receiving at the district office about illegal conversions and communicate the information to the Department of Buildings (DOB) before they conduct their inspections.
Josephine Beckmann, District Manager of Brooklyn Community Board 10, described how she also analyzes 311 data to look into potential problems with the Owl’s Head Wastewater Treatment Plant in her district:
…once a month, I look at my odor complaints at the plant, and if I see an uptick, I will reach out to the Department of Environmental Protection to ask if there are any issues at the Owls Head Wastewater Treatment Plant?” 9 out of 10 times, the answer is yes. “We’re changing the carbon filters, or we’ve begun this capital project.” So I’m able to stay on top of the needs of the district by reviewing that data.
Anya Hoyer, Community Coordinator at Brooklyn Community Board 14, noted how she uses 311 data to monitor rodent complaints in her district. Hoyer created both heat maps and points maps[23] in Socrata to display rodent complaints made to 311. She described how toggling between the heat map and the point map helped her better understand the rodent issues in the district — helping to identify whether there is a problem with a general area of the district or whether there is a problem with a specific building. Having this information available helped the district office better communicate about the issue to the Department of Health and Mental Hygiene (DOHMH).
Complaint Data as a Triage Tool
A few boards described using 311 complaint data to figure out how to prioritize certain capital and expense priorities in their district needs statements. Josephine Beckmann, District Manager of Brooklyn Community Board 10, described how she uses 311 data to discern the worst street conditions in her district:
…when looking at some of our capital and expense priorities, like for example, roadway resurfacing — residents submit service requests for street defects all the time. What we’ve done is actually map our potholes and street cave-ins, and, armed with that data, go out to inspect those roadways that have had the most complaints. We select a a baseline threshold — say if a location has more than 10 complaints in one year — we will go out and visit the site. We compile street locations in need of reconstruction or resurfacing and refer those locations to the Department of Transportation. This is a big improvement from prior to this data being available. Years ago we had to drive down every street in the district, we now take a look at the data first before we go out to compile our list.
Figure 3: How Community Boards Engage with 311 Data.[24] |
|
DiscoveryHow do community boards hear about this service, and what entices them to use it? |
Community boards learn about opportunities for accessing and manipulating 311 data at trainings offered by their borough presidents and BetaNYC. |
AccessThrough what pathways do community boards access the service? |
Community boards access 311 data through the City’s Open Data Portal (run on the Socrata platform) or through BetaNYC’s 311 dashboard, BoardStat. When they enter the Open Data Portal, they see 18 million rows of data – representing all service requests made to 311 since 2010. When they enter BoardStat, they see tables summarizing all of this 311 data for a certain borough. |
EngagementWhat are the steps to engaging with the service? |
Community boards filter 311 data to their districts, a relevant date range, and/or a relevant complaint type. They may count the number of rows for each complaint type in their district to discern the most pressing complaints. They may count the number of rows per address to highlight the addresses where the most service requests have been made. Often, they will map the data to visualize it. |
ResultsHow do community boards leave the experience? What have they learned? |
Community boards finish engaging with the service when they have gathered the information they need to legitimate concerns they have identified, to investigate the location and frequency of issues in their districts, or to triage budgetary priorities in their districts. |
ImpactWith whom do community boards share their findings? |
Community boards share their findings with liaisons at city agencies, elected officials, or community members. They may present their findings to a developer or business owner that comes before the board. They may also write their findings into reports or into their district needs statements. |
Land Use Data as a Reference Tool
Most boards mentioned that at least a few of their members, particularly those with architecture, construction, or urban planning backgrounds will use tools like the DCP’s Zoning and Land Use Map (ZoLa)[25] to look up zoning and land use information in the City. More specifically, when a Uniform Land Use Review Procedure (ULURP)[26] application, a Boards of Standards and Appeals (BSA) application, or a landmark application comes before their board, they may use ZoLA to look up how an area is currently zoned, how a building use is classed, and/or what units are nearby. Amongst community board members and district office staff, ZoLa is primarily used as a reference tool rather than an analysis tool. Diana Switaj, Director of Planning and Land Use at Community Board 1, noted her board uses ZoLa as a “context setter”:
I think more primarily, it feeds into just like background research, like if we get an application that’s the first thing we do to find out what the context is. It’s a good context setter. And also great if you need really specific information — you know — it’s one of the tools in the toolbox that most primarily helps us establish context and whatever comes our way.
Anya Hoyer, Community Coordinator of Brooklyn Community Board 14, noted that she uses ZoLa regularly to respond to calls to the district office voicing concerns about upcoming development. When fielding such calls, the district office will use ZoLa to check whether the zoning in that area permits the development of larger buildings.
Historical and Visual Data as a Context Tool
Several types of material information that fall outside the scope of the City’s and State’s definition of “data” play important roles in community board work. When making a certain land use or licensing decision, community boards will reference records of resolutions they have written in the past — sometimes because the past resolutions deal with the same property under consideration and sometimes because the past resolutions serve as a template for how they previously addressed a similar issue. Jesse Bodine, District Manager of Manhattan Community Board 4, described how he collates this information and makes it available to his board when they need to make a decision on a land use proposal:
What the office does standard is we have a dropbox and, … we’ll put the [application] in the dropbox. … If there’s relevant material outside of the application (let’s say it is on a project that’s looking to be a new subdistrict of the West Chelsea special district) we’ll typically put … our letters on the Special West Chelsea District [in the report]. If we did a report on something like that, we’ll put that in. … It’s whatever we have in our folders … [or] in the office. … There’s boxes and boxes of stuff about topics such as Hudson Yards. There’s no way that I’m getting that to anybody, and there’s no way that volunteer members is going to be able to synthesize that. But we put relevant background material in to give it context, so that they [Board Members] can see what we’ve voted on in the past about it, and things like that.
Additionally, photographs of a building and nearby sidewalks are sometimes submitted with resolutions in order to demonstrate how a land use decision will impact a surrounding neighborhood. A letter written by a member of the community may be included in a resolution as “data” about the needs of a community.
This more qualitative information helps community boards contextualize an issue, which both 1) aids board members in understanding the stakes and subtleties of a proposal change and 2) helps them communicate these stakes and subtleties when putting together their resolutions.
Challenges
Through our research, BetaNYC has identified several challenges that inhibit community boards from using city and state data resources to broaden their understanding of issues that come before the board and/or to substantiate claims they make in resolutions. In each of the following sections, we outline some of the issues that make it difficult or impossible for community boards to access or reference city and state data in their work. We start off with smaller-scale technical issues, focusing on problems with the data itself. However, not all roadblocks to city and state data use are technical; as we move through these sections, the challenges broaden in scale, ranging from the challenges of incorporating data access and analysis into daily practices to the challenges of acknowledging how community board cultures have traditionally relied on legacy knowledge and anecdotal evidence to advance decision-making (see Figure 4). Recognizing the multiple scales of challenges to leveraging city and state data resources in community board work is important: it prompts us to acknowledge that the challenges cannot be overcome with technological solutions alone. City agencies, elected officials, and civic technologists need to be thinking towards advocating for and supporting pedagogical, institutional, and cultural information needs, in addition to technical ones.
Challenge 1: The city or state data hasn’t existed or hasn’t been published in an accessible format.
There are many city or state data resources that community boards would like to reference in their work but currently do not exist or have not been published in an accessible format. For instance, many boards would like better data about the number and location of vacant storefronts in their districts. However, there is no city agency that is responsible for collecting and reporting that data. If it does exist for a district, it is because a Business Improvement District (BID) has collected it or because a district office has surveyed their streets themselves. We have also heard from boards that the lack of open, accessible data about 911 calls to the NYPD has made it challenging to track crimes at establishments with upcoming liquor license renewals.[27]
Further, sometimes city or state data gets published in a format that cannot be read by data analysis software or mapping software. For instance, the Rent Guidelines Board (RGB) publishes data about buildings that contain rent-stabilized units[28] as a series of PDFs (compiled by Borough). The only way to map this data is to scrape the PDFs. Similarly, while the amount a building owner pays in property taxes is public record, there is no dataset that reports in bulk the property taxes paid by every building in the City. The Department of Finance (DOF) has an online tax look-up site[29], where you can look up tax bills by their Borough Block Lot (BBL)[30] or address, but this returns data as a PDF. Again, the only way to map this data is to scrape the PDFs for every BBL in the City.
Challenge 2: The city or state data hasn’t been up to date or timely.
In some cases, boards and district offices have opted not use a city or state dataset in their workflow because the data has not been updated in several years. For instance, for several years, the Department of Transportation (DOT) published bi-annual pedestrian count data in 114 locations throughout the City. Every six months, they would record the number of pedestrians walking by a location in the morning and evening on both a weekday and a weekend. However, for a while, the most recent pedestrian count data on the Open Data Portal and on the DOT’s website presented counts taken more than two years prior. As retail corridors and residential neighborhoods have been in constant flux over the past decade, there is great need for timely data about city foot traffic.[31]
Shawn Campbell, District Manager of Brooklyn Community Board 14, also described how the DOT will send a list of street opening permits to her district office, but because of the way the permits’ issue and expiration dates are recorded, it is difficult to use the information to track when street openings are actually happening. Similarly, in the City’s Open Data Portal, the DOT datasets reporting street closures mark the dates for which the permit has been issued (which can span several weeks) — not the days or hours during which the street will actually be closed.
Challenge 3: The city or state data’s geography has made it irrelevant to addressing the issue.
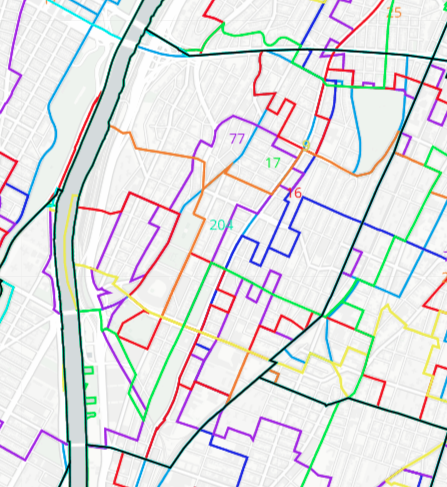
In some of our interviews, district managers described that there are datasets that they would like to use to better understand the problems facing their districts but that the data’s geography makes it unsuitable for characterizing an issue at the community district level. Susan Stetzer at Community Board 3 described the need for better health statistics in her district — particularly to report on the prevalence and concentration of issues like smoking, diabetes, and obesity. She noted that DOHMH has done a health survey in the district, but that it is difficult to draw meaningful insights from the survey because the numbers report an average over the entire district. Because Community Board 3 is so diverse (including the Lower East Side and parts of Chinatown), these numbers do not provide useful information about where health issues are concentrated and whether they may be impacting particular demographics of citizens.
There are a number of official ways to divide NYC’s geography. Each of NYC’s boroughs can be further divided into community districts, council districts, health center districts, sanitation districts, school districts, police precincts, and neighborhood tabulation areas — just to name a few. The borders of these subdivisions, for the most part, do not align with each other (see Figure 5).[32] When a dataset is reporting something at a single unique location (at an address, a building, or geographic coordinates), it is possible to use the DCP’s geoclient service[33] to enter in that location and have returned each of the many districts to which that location belongs. However, when a dataset reports an average over a certain sub-geography, it isn’t possible to make that data commensurate with other sub-geographies. For example, DOHMH publishes a number of datasets reporting health statistics (such as HIV/AIDS diagnoses) averaged over a particular United Hospital Fund (UHF) neighborhood. It is not possible to use this data to discern health statistics for community districts because the borders of the UHF neighborhoods do not match those of community districts.
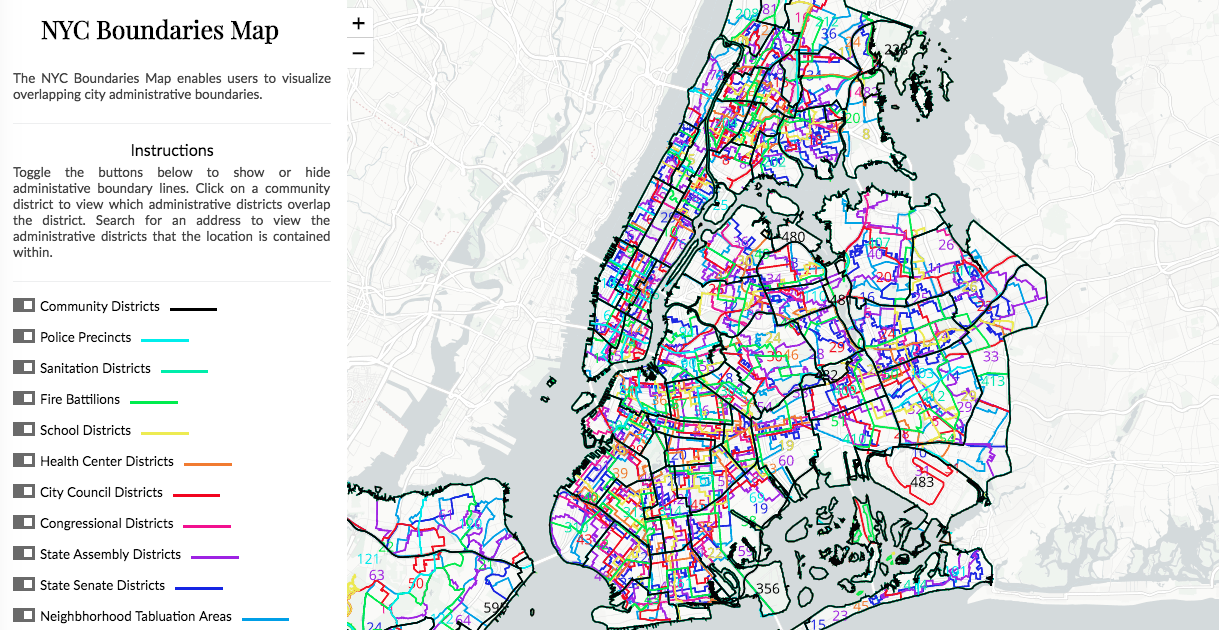
Stetzer further noted that, because her district is so demographically diverse, when the Board cites census data in their work, they often will break the geography up into 10 custom sectors. She acknowledged that the City divides districts into neighborhood tabulation areas — subdivisions of a community district that align with census tracts — and that these areas could be used to map the demographics of smaller portions of her district. However, the way that the City subdivides a district into neighborhoods does not necessarily align with the way the board needs to divide demographic data because, especially in Community Board 3, the City’s divisions produce neighborhoods with drastically diverse populations. In many cases, there are very wealthy residents in the same neighborhood that there are very poor residents, and the data would average out, hiding communities that deserve more attention. She described:
One of the demographers at City Planning has this quote everybody quotes: “If you have one foot in the refrigerator, and the other foot in a fire, that doesn’t mean that you’re doing fine.” But that’s what it looks like on paper. And we have to show the true story of our community — that we have a lot of low-income people with dire needs here. And a lot of much wealthier people — younger, wealthier people here.
When BetaNYC asked her how she went about drawing those boundaries, she responded that at first, knowing the community really well, she drew them by hand. After this, she adjusted them to follow census tract lines.[34]
Further, datasets published at the state-level (such as datasets about licenses) and the federal level do not include references to the City’s geographic identifiers. State datasets do not reference the community board in which a licensed establishment is located, the unique identifiers DCP assigns to city lots (BBLs), or the unique identifiers DOB assigns to city buildings (BIN). This can make it difficult to merge city geographic datasets with state geographic datasets.
Challenge 4: The city or state data’s categorization has made it irrelevant to addressing the issue.
Some district managers also described instances where they would like to use city or state data to analyze or address an issue in their community, but that the way the data gets categorized makes it impossible to do so. Josephine Beckmann, District Manager of Brooklyn Community Board 10, described that she would like to be able to determine the frequency and location of complaints about illegal parking occurring in bus lanes. She noted that when cars are parked in bus lanes, it makes it much more difficult for seniors and disabled individuals to get on the bus. She described wanting to be able to identify areas of her district where this is happening frequently so that she can advocate for better signage and so that she can direct NYPD to monitor these areas more frequently. However, in 311 data, complaints about illegal parking in bus lanes are lumped into the category “Posted Parking Sign Violation,” which can include anything from parking in a bus lane to parking during street cleaning to parking in a loading area. There is no way to figure out which proportion of these complaints are due to illegal parking in a bus lane.
Similarly, in Manhattan Community District 8, Will Brightbill noted that the primary concerns his board raises in response to liquor license applications and sidewalk café applications regard whether the establishment will use e-bikes for deliveries. He noted that many of his board members are concerned that e-bike riders are not obeying the laws — riding up on sidewalks and threatening pedestrian safety. There is no way to track or substantiate this through 311 data however because of the way complaints about bikes get categorized. All complaints about bikes, e-bikes, roller skaters, and skateboards get lumped into the category “Bikes/Roller/Skate Chronic.” There’s no way to discern the nature of the complaint made against a biker or a skater, and there’s no way to discern the extent to which the problem is stemming from e-bikes vs. bikes and/or skates.
Both of these examples demonstrate the need for finer granularity in 311 schemas. However, finer granularity can come at a cost. There are currently over 275 categories for complaint types represented in 311 data, and over 1400 sub-categories (or descriptors). The more granular the categories become, the more difficult it is to maintain the schema’s organization in a way that makes sense to diverse audiences. With the finer granularity, it can be difficult for consumers of the data to know that they have to query multiple complaint types and descriptors to identify issues such as where odors are coming from in their districts. The following categories have all been used to categorize odor complaints in 311: Odor; Chemical Odor; Chemical Vapors/Gases/Odors; Sewage Odor; Odor in Sewer/Catch Basin; Taste/Odor, Sewer; Air: Odor, Sweet from Unknown Source; Air: Odor, Nail Salon; Air: Odor/Fumes, Private Carting; Air: Odor/Fumes, Restaurant; Animal Odor; Pigeon Odor. This is why it is so important for data producers to engage community boards and other consumers of the data when coming up with data schemas — so that they can get input on when it makes a difference to mark a categorical difference. There are rich opportunities for both 311 and city agencies to engage users and collect their feedback when updating data schemas.
Challenge 5: Boards and district offices have not had the technical infrastructure to analyze and visualize city or state data.
To access city or state data, boards and district offices need a computer and a high-speed Internet connection. To manipulate data offline, they need enough bandwidth and computer storage to download sometimes very large datasets. To analyze and visualize the data, they need access to spreadsheet software such as Microsoft Excel, statistical software such as RStudio, visualization software such as Tableau or PowerBI, or mapping software such as ArcGIS. While there are open source options for many data analysis software systems, getting this infrastructure in place always comes with a cost to community boards — a cost of bandwidth, a cost of storage space, and a cost of time to implement. Many community boards need additional technical infrastructure and financial resources to support this kind of work.[35]
When district offices do purchase software for their boards, there can also be a challenge to making it accessible to board members. Susan Stetzer, District Manager of Manhattan Community Board 3, described how she purchased an ArcGIS license at the request of her board several years ago; however, board members have never used it. The office’s hours of operation overlap with many board members’ day jobs, making it difficult for them to come in and make use of the software.
Challenge 6: Boards and district offices haven’t had the data literacy to access and analyze city or state data.
There is a significant learning curve involved in data access and analysis. Community board district office staff and members tend to have expertise in fields such as city planning, political science, or law, but few staff and members have backgrounds in or experience with data science, information science, and/or statistics. Few also have training in interrogating data biases.
Some district offices suggested that they would use more open city or state data if they knew how to access and analyze it. Angel Mescain, District Manager of Community Board 11, described:
I wish that I was better at deciphering the datasets — like using them as an individual. I think that then I would be more helpful to my membership. If I had a better grasp of it. … [Open data] just became a flood… And I’ll be frank. I just haven’t had the time to get good at it. And it’s all available, and I hear folks [say], “use this for this, use this for that.” … I could certainly use help in that regard.
In district offices that do use open data in their work, staff members often have not received formal training but instead have taken time to tinker with the systems on their own. The Manhattan Borough President’s Office (MBPO) has offered workshops to community board members about how to access the City’s Open Data Portal and how to download datasets relevant to community board work.[36] Similarly BetaNYC has offered classes throughout Manhattan and in parts of Brooklyn, which have introduced data literacy vocabulary and described how to use several city and state data analysis tools.[37] BetaNYC’s Civic Innovation Fellows have also added data analysis capacity to community boards — designing “data journeys” that walk individuals through working with a variety of datasets to contextualize and address civic problems. However, not all board members are able to attend these trainings, since, as volunteers, they are already devoting several nights a month to community board work.
Challenge 7: Boards and district offices haven’t had the time to access and analyze city and state data.
For community boards and district offices that are already strapped for time and resources, it can be difficult to integrate data access and analysis into their workflows (even when relevant data has been published in an open format on the City’s Open Data Portal). There is a great deal of invisible work that goes into data access and analysis. Individuals need to discern the type of data that can support their work, and since they often do not know whether that data exists, they have to experiment with search queries to track it down on the City’s Open Data Portal — a platform archiving a few thousand datasets. To figure out if a dataset meets their needs, they need to download and read through the dataset’s data dictionary[38] — getting acquainted with what each field represents. They also need to figure out whether and how they can filter and order the data according to the appropriate timeframe, geography, or issue.
Data “munging,” or the process of cleaning and preparing data for analysis and presentation, is perhaps the most time-consuming aspect of data work, and is particularly time-consuming when working with municipal datasets. Out-of-the-box city or state data often need to be considerably cleaned and refactored in order to be incorporated into a data visualization. While NYC has been at the forefront of instituting standards to ensure that published datasets are useful to the public, many of the datasets on the City’s Open Data Portal are not yet in compliance with those standards. For example, Local Law 108 of 2015 required that every dataset containing geographic units include a standard set of fields, including street addresses, geographic coordinates, and community districts. However, while the City’s Open Data Team is working tirelessly with agencies to ensure that their datasets meet this standard, numerous city datasets are not in compliance with these standards — many only including house numbers and street names as geographic units.[39] To visualize this data on a map, the dataset needs to be geocoded with the DCP’s geoclient, which can be a cumbersome process, often involving manual editing of addresses that get rejected by the application. Further, the most useful visualizations often involve showing a correlation between data in multiple datasets. For example, a community board may want to show that there has been an increase in noise complaints in locations where more sidewalk café permits have been issued. However, presenting this requires aggregating data that may have been collected over different time periods, across different geographic borders, for different purposes, and according to different categories. To display this data in a unified view, an analyst needs to wrangle with each dataset (filtering it and figuring out how to proportion and reallocate data in mismatched categories) to get their boundaries to align.
Many community boards have expressed to us that data insights could be valuable to their work, but that offices and board members just don’t have the time to invest in it. When community boards do carry out projects that involve significant data-crunching, they very often get carried out by Community Planning Fellows,[40] who have more time to devote to learning and leveraging the City’s data resources.
Challenge 8: Boards and district offices know that data has gaps and biases.
In several interviews, district managers noted their hesitation to rely on statistics alone in decision-making because statistics tend to over-simplify the nuances of complex situations. In particular, concerns about the representativeness of 311 data have come up in just about every interview that we’ve conducted — particularly in response to inquiries about whether and where data tools are currently being used in the board’s workflow. A main source of this concern is that 311 is not exhaustively representative of the complaints within a community because not everyone with an issue calls 311. This may be because they can’t call 311 (because at that time they don’t have access to a phone, because they’re riding a bicycle or underground, or because they don’t have time to call). It may be because they don’t know to call 311 or even that an option for fielding complaints to the City exists. It may be because they choose not to call 311 (because they decide it’s not worth the wait time or because they’ve already made several complaints without progress). We’ve also heard concerns that the demographics of people that call 311 biases the data towards the concerns of more affluent individuals — perhaps misrepresenting broader concerns within the community.
To the extent possible, NYC311 does not record any personal information about callers. Looking at 311 data, there is also no way to tell whether a series of complaints about a particular establishment were reported by several people or one person calling consistently over time. In this sense, it can be hard to tell whether a saturation of complaints at one establishment represents widespread community concern or the concerns of a single individual (and potentially an individual holding unfair prejudices against an establishment). Many community boards understand that they need to take this possibility into consideration when reviewing the data.
Another concern about 311 data is the way that agency responses are represented. For instance, one board staff member shared that upon looking at the data representing an NYPD’s response time, they were immediately skeptical of the dataset as a whole because they know the agency doesn’t operate that way. Once a ticket has been assigned to an agency, it is up to the agency to report data back about the status of the ticket, and agencies have leeway to interpret what various status categories (like “Pending” and “Closed”) mean. So, even though 311 may report that certain agencies are closing tickets quicker than other agencies, this could be because the agencies are interpreting what it means to close a service request ticket in different ways.
Further, viewing trends in the data over time can eclipse the context of certain issues. For instance, the number of heat and hot water complaints made to 311 looks different over the course of a full year than it does over the course of the winter season. Noise complaints tend to be higher in the summer months, and missed trash pick-up complaints tend to be higher in the winter months when the City has to contend with snow. Viewing these complaints over the course of the year tends to hide these nuances.
Jesse Bodine, District Manager of Manhattan Community Board 4, described how relying on the stories that 311 data tells without considering this broader context may not be the best use of city information:
I think there’s this thought that boards should only look at 311, and … see where the spikes are and then that’s what we [Board Offices] should be focusing on. And I’m not 100% sure that’s what we actually should be doing. …because simply just getting the complaints is a limited amount of information. We need to know the context … Each of the problems are so unique and have their own world. … You can just look at the 311 list and say “after hours construction noise is the #1 DEP complaint in our district almost every month.” I could see there’s some use of bringing in DEP and [asking] “what are you doing about this?” … But each of those sites are unique, and there’s certain of those sites that we agree with. Obviously Saturday work, things like that, we’re not a fan of that. But there’s other projects where we need to give them some flexibility. So … I’m not 100% clear on how boards should be using 311 data in that way. I think there’s plenty of other ways that we do use it, and I think it’s helpful, but simply I’m just sort of stating the top 311 issues and using that as a board issue: I’m not 100% sure.
Finally, BetaNYC has heard from district managers that one reason why certain complaints may spike in the 311 dataset is because the City puts out advertisements to call 311 about that particular issue. Shawn Campbell, District Manager of Brooklyn Community Board 14, and Anya Hoyer, Community Coordinator, noted that they recognized a huge spike in 311 complaints about homeless people over the past few years, but that the spike coincided with the City’s development of an NYC.gov app to report homeless people and PSAs to call 311 for homeless assistance.[41]
Figuring out appropriate ways to cite data despite known data quality issues and data biases is very difficult. It requires contextualizing the data — understanding how it is collected, categorized, and displayed — and contextualizing the social circumstances that enable it to exist. More often than not, this contextual information is not readily available with the data — in part, because those producing the data have not taken the time to record it, and in part because no one can fully know or anticipate the ways in which datasets can misrepresent a situation. While data dictionaries may provide a definition for each category, they do not explain why categories get divided the way that they do or the processes by which data gets tagged with certain categories. They also do not report on known data gaps or the range of social and political reasons why there may be spikes in the dataset at certain periods of time. Thus, often data can tell a story that does not match a community district’s ground truth.
Challenge 9: Boards and district offices have been unaccustomed to working with data resources.
[perfectpullquote align=”left” bordertop=”false” cite=”” link=”” color=”” class=”” size=””]In order to leverage data resources effectively, responsibly, and ethically, community boards need to build an understanding and a discourse around when it is appropriate to trust data representations as evidentiary and when it is not.[/perfectpullquote]Many district managers we interviewed noted that their boards have operated in consistent ways for quite a long time — that they’ve based their decision-making off of their personal knowledge of their communities, the voices of community members that come before their board, or precedent of resolutions the board has made in the past. Introducing city and state data resources to board and district office workflows is a major culture shift — altering the balance of whose voices get prioritized, what counts as evidence, and how decisions get made. Expanding data literacy and querying the possibilities/limits of leveraging data in community board work represents not just a change in practice but also a change in values, and it is important that these changes do not get caught up in what Kate Crawford calls a “data fundamentalism” — where those leveraging data come to believe that “correlation always indicates causation, and that massive data sets and predictive analytics always reflect objective truth.”[42]
These changes are further complicated by the fact that any dataset can be manipulated in such a way as to tell a story that negatively impacts a community. Many community board members have witnessed or experienced the harm that can be done to communities when data, reporting to represent their problems or needs, in fact acts as a surveillance tool, a profiling tool, or a tool to justify withholding much-needed community resources. In order to leverage data resources effectively, responsibly, and ethically, community boards need to build an understanding and a discourse around when it is appropriate to trust data representations as evidentiary and when it is not. They have to strike a careful balance between claiming data to offer a more objective and comprehensive picture of what’s going on in their community, while also recognizing that data representations are never really objective or comprehensive and can often be used to tell a story that refutes their ground truth. Encouraging community boards to simply value data or unquestioningly incorporate it into their workflows is an inappropriate goal, ignoring the very real damage that automated or data-driven decision-making can and has inflicted on communities. Instead, community boards need support in learning to work in the face of conflicting demands. They need help in figuring out appropriate ways to gather and reference information about issues that they have not personally experienced, while also keeping a cautious and skeptical eye towards always already limited information that could potentially be wielded against them. Figuring out how to do this is very challenging.
Use Cases
Through our research, BetaNYC identified a number of scenarios where community boards could benefit from more accessible, more comprehensive, and/or more interactive city and state datasets and tools. In interviews we asked district managers to elaborate on some of the key information gathering tasks carried out by their offices and/or community board committees. We asked about who was currently responsible for gathering this information, the steps these individuals took to gather it, how it was being applied in decision-making, and how it was being referenced in resolutions, reports, and district needs statements. We also asked district managers to identify forms of city and state information that they would like to have more accessible to their boards. For some of the topics they mentioned, datasets characterizing the issues are available through the City or State but are difficult to access. However, in many cases, the data is currently not being produced by the City or State, not being made public, or not possible to filter to the community board level.
In the use cases below, we outline several specific scenarios where having access to dashboards that creatively visualize city and state data can support community board members and district office staff. The use cases demonstrate how open data can help them aggregate disparate information, analyze the diverse needs of their communities, legitimize known issues, or build narratives that counter the narratives of powerful stakeholders. We also outline some opportunities for the City and the State to improve these data resources, along with steps that BetaNYC has taken to make the data more accessible.
Use Case 1: Tracking the Location and Saturation of Vacant Storefronts
Use Case 2: Aggregating Information to Prepare for State Liquor Authority Applications
Use Case 3: Monitoring the Issuance of After-Hours Variances
Use Case 4: Monitoring Rent-Stabilized Units and Tenant Displacement
Use Case 5: Tracking Street Closures
Use Case 6: Tracking the Number of Sanitation Workers and the Frequency of Collection
Tracking the Location and Saturation of Vacant Storefronts
Concerns about the number and saturation of vacant storefronts have become pervasive across the City, particularly as commercial rent prices are on the rise. Vacant storefronts are typically an indicator of harm to the small business community. As commercial rent prices rise, small businesses get priced out of their units, making it only possible for larger chain stores and high-end retail to rent the units. This is not only detrimental to small businesses but also to local residents. As small businesses such as grocery stores, drug stores, laundromats, and hardware stores close down, local residents cannot access necessary provisions at affordable prices. As a result, across the City, individuals are being priced out of their neighborhoods not only because of rising rent prices but also rising retail prices. There are many incentives for property owners to keep storefronts vacant. For one, it gives them an opportunity to the hold out for the highest possible offer. Further, the City’s business tax policy allows property owners to offset net operating losses against net income in a given tax year; with zero income from vacant properties and continuing maintenance costs, there are considerable tax incentives to keeping a storefront vacant.[43]
Community boards would like access to data about the number, location, and saturation of vacant storefronts in their districts so that they can advocate for sensible commercial rent regulation laws. Further, knowing the number of vacant storefronts on particular streets in their district can help boards in deciding whether to vote for or against changes to a zoning district or a zoning variance. However, currently, the City has no way to track vacant storefronts. District offices will sometimes contact their local BID offices to get pieces of that data; however, restricted to certain regions of the district, this does not give them an overview of the vacant storefront problem for the entire district. Some district offices have canvassed their communities to count vacant storefronts. One District Manager in Manhattan noted that they had interns go out in the district to document all of the vacant storefronts.[44] Community boards certainly do not have the time and resources to make this a standard practice, however — particularly because the rate at which storefronts can go from occupied to vacant or vice versa is so rapid. It would be extremely difficult to keep that dataset up to date.
Opportunities for Improvement
BetaNYC has considered the feasibility of implementing a number of different policies and practices for tracking vacant storefronts, including monitoring Yelp information about commercial openings and closings, tracking changes in active business licenses, and requiring certificate of occupancy records for all commercial units. We have found that Yelp data tends to be less accurate in communities with less digital connectivity and that many businesses throughout the City do not require licenses at all. Further, implementing policies to monitor occupancy on a unit-by-unit basis would be prohibitively cumbersome for any city or state agency. Finding shortcomings in all of these approaches, as a near-term solution, BetaNYC is in support of legislation that would require landlords to report when a commercial unit has been vacant for more than three months.[45]
- Recommendation 1: BetaNYC suggests that a landlord-reported vacancy dataset be updated on the City’s Open Data Portal daily, that it comply with the City’s geospatial open data standards (additionally including fields for the BBL and the Building Identification Number (BIN) of the property), and that it be published in a machine-readable format.
- Recommendation 2: We also recommend that the City take care in defining what counts as a storefront and what counts as a vacancy. In order to interpret the data responsibly, civic technologists and those using the tools that they design need to know details such as whether basement buildings and second floor units count as storefronts and whether a pop-up store moving into a unit constitutes the unit no longer being considered vacant. We recommend that this information be included in the dataset’s data dictionary, which (according to Local Law 107 of 2015) must be included with any published city dataset.
What BetaNYC Has Done
At BetaNYC, we have begun attempting to reverse engineer vacant storefront data. Using the Department of City Planning’s PLUTO dataset, we mapped every lot in the City and removed from the map lots without a commercial building class. In doing so, we created a map of all city buildings that potentially include a storefront. We then gathered several city datasets that listed locations for actively licensed city businesses, including the Department of Consumer Affairs (DCA) “Legally Operating Businesses”[46] dataset and data we scraped from the New York State Division of Licensing Services portal[47] about licensed barbershops and beauty salons in the City.[48] We removed these buildings from our map of commercial buildings, theoretically revealing where there may be a vacant storefront.
While this did significantly narrow down potential locations where there may be a vacant storefront, there are notable data quality issues that make it difficult to continue advancing this approach. First, not every business in the City requires a license. We cannot find data about the location of active clothing stores, bookstores, furniture stores, and pharmacies. The other challenge is that not all buildings that have been classed with a commercial use actually contain a storefront. Further, a building may have multiple storefronts — some of which are vacant and some of which are not; however, if just one legally operating business is associated with that building in the map, the entire building is hidden from the map, overlooking other potential vacancies in the same building. These challenges would be particularly difficult to overcome without redesigning each of the data sources we are using to design the map, and this is why BetaNYC is supportive of legislation to produce a dataset with landlord-reported vacancies.[49] We encourage community board members and civic technologists to track this legislation and emphasize the importance of having it accessible to their city council members.
Aggregating Information to Prepare for State Liquor Authority Applications
When establishments in a community district apply for or renew certain types of liquor licenses, that district’s community board is given an opportunity to review the application and advise the State Liquor Authority (SLA) as to whether the application should be approved. For the most part, the SLA will approve license applications, regardless of the community board’s input, unless there is a particularly compelling reason not to do so. If the establishment is within 500 feet of 3 or more establishments with the same license, the license will only be approved if the SLA deems that it is in the public interest to do so.[50] In such cases, community boards will hold a hearing and gather information from the community, and if there is opposition to awarding the license, community boards and applicants can work out stipulations — such as noise control measures and permitted hours of operation. Once agreed upon, some of these stipulations get incorporated into the applicant’s methods of operation, and once approved by the SLA, they become enforceable. Some boards report that the SLA will only approve the number of stipulations that they can physically fit on a license. Other stipulations go on record as informal agreements between the community board and the establishment.
Ebenezer Smith, District Manager of Manhattan Community Board 12, described the lengthy set of steps that his district office staff follow to gather information about an establishment applying for or renewing a liquor license:
For my assistant here — it’s a full time job just to prepare the Licensing Committee Meetings. … Right now to prepare for one particular application, you need to consult Department of Health because [the board] want[s] to know the letter grade for the restaurant and the history. We need to pull that out. We need to know from the SLA … if the license is active, how many licenses, etc. We need to know from the police department any violation. [Often] we just send information to the police, and the police participate in the meeting. And [we need to aggregate] all resolutions that have been passed regarding that particular address. So all of that has to be pulled for one application. And if we have 27 or 30 applications it takes a lot of time; that’s what we have.
Josephine Beckmann, District Manager of Brooklyn Community Board 10, noted that she will also look up the establishment’s Certificate of Occupancy[51] when preparing materials for her board to review for liquor license applications, and Cody Osterman, a staff member at Manhattan Community Board 6, noted that his board will not hear a license application until the applicant submits the Certificate of Occupancy, along with a filled out questionnaire.
Most of this data is available online. DOHMH publishes restaurant inspection results, including health grades, for each restaurant in the City. The SLA publishes a dataset, updated quarterly, which lists active liquor licenses across the State. They’ve also produced a map (the NYS Liquor Authority Mapping Project or LAMP)[52] where users can look up any disciplinary action the SLA has had to take against a licensed establishment. Many noise complaints to which NYPD responds originate in 311, so can be filtered from 311 service request data. Finally, a PDF of an establishment’s Certificate of Occupancy can be viewed by looking up its building address on the DOB’s Building Information System (BISweb). The main challenge then is that all of this information is siloed in different datasets and portals and has to be aggregated manually. When community boards receive several dozen applications each month, it can be quite a time-consuming task to compile the information.
Notably, there is no guarantee that gathering and submitting this information to the SLA will have an impact on the outcome of the State’s decision. The SLA has communicated to boards that, because they receive several thousand applications a year, it is difficult to investigate concerns and build a case against a particular establishment during the 30-day renewal process. Because of this, even when the community board raises many concerns about an establishment during the renewal process, the SLA is likely to award the license. The SLA has encouraged community boards to flag violations at an establishment as they are occurring rather than waiting for the renewal process to begin. However, the community board often does not know about violations until the community has had an opportunity to voice their concerns during a renewal process. One reason for this is that stipulations are currently not publicly visible. To get state-enforced license stipulations, an inquirer would need to submit a Freedom of Information Law (FOIL) request to the SLA, and depending on the SLA’s schedule and the number of requests they are processing, it could take weeks to get a reply about one establishment. Informal agreements between the establishment and the community board are typically printed as a PDF and stored in a district office filing cabinet. Thus, community members often do not know when/that an establishment is violating a stipulation, and community board members do not have the time and resources to audit every licensed establishment in their districts. Cody Osterman, a staff member at Manhattan Community Board 6, explained:
If we put a stipulation that they close at 2, and they’re open until 4AM, how am I going to [know?] I don’t live in this district. I don’t walk in the streets. It has to be basically that a community member knows that they’re supposed to close at 2 from the stipulation and sees them at 4 and emails us, or a board member on that committee, or another board member who has a strong memory of all the resolutions that come through is walking down the street at 4AM and sees, “oh that place is supposed to be closed at 2.” There’s no way for us to enforce that.
Opportunities for Improvement
Ideally, community boards could reference one system to gather all of the information they need to review before a new application or a renewal. However, it is particularly difficult to pull all of this information into a unified view because a different City or State department manages each dataset. The SLA has one way of uniquely identifying a licensed liquor establishment, which is different than the way the DOB uniquely identifies a licensed building and different than the way DOHMH uniquely identifies a restaurant. The only unique field in common across all of these datasets is the establishment’s location, but even the values in this field can differ based on how the agency records location data.
- Recommendation 1: In general the City and the State should develop better mechanisms to link related data across departments and include these identifiers in their published datasets.
Currently, it is only possible to look up disciplinary actions taken against a licensed establishment by looking up a specific address on the LAMP map and checking to see whether that address has disciplinary actions listed. The data cannot be downloaded and used in other applications
- Recommendation 2: The SLA should publish disciplinary actions taken against licensed establishments in an open format on the State’s Open Data Portal.
Finally, community members should be able to look-up liquor license stipulations through public query tools so that they can notify a community board early on when a licensed establishment is violating a stipulation.
- Recommendation 3: Borough President’s Offices should work with community boards to standardize the way that stipulations agreements between a board and a licensed establishment get recorded and provide community boards with staff and technical resources to digitize new and existing stipulations in an appropriate format.
What BetaNYC Has Done
At BetaNYC, we developed a new tool called SLA Mapper or (SLAM).[53] SLAM is a map that aggregates a great deal of information that community boards and district offices typically have to look up in different places when reviewing liquor license applications. The map includes markers for all establishments with liquor licenses throughout the City and highlights liquor licenses that will be expiring within the next year. The map also includes markers for all establishments with sidewalk café licenses. Clicking on sidewalk café or liquor license markers provides users with additional information about the license, such as its status, when it was issued, and when it will expire. Users can also check sidewalk café allowances, including the square footage of the café and how many table and chairs are permitted on the sidewalk. Through SLAM, users can also easily check the DOHMH restaurant grade history for every restaurant in the City, as well as the noise and drinking complaints made about a restaurant/club/bar since 2017. Finally, users can be linked directly to the Certificate of Occupancy the DOB has on file for each establishment with an active liquor license throughout the City. We have begun conducting preliminary research on how to incorporate license stipulations onto the maps.
We encourage community boards to experiment with SLAM and send us their feedback on how it can be improved.[54] District office staff can use the tool to check an establishment’s service request history when they receive a call complaining about the establishment. Licensing committees and streetlife committees can also use the tool when reviewing liquor license applications and sidewalk café applications. Civic technologists can contribute new features via GitHub.
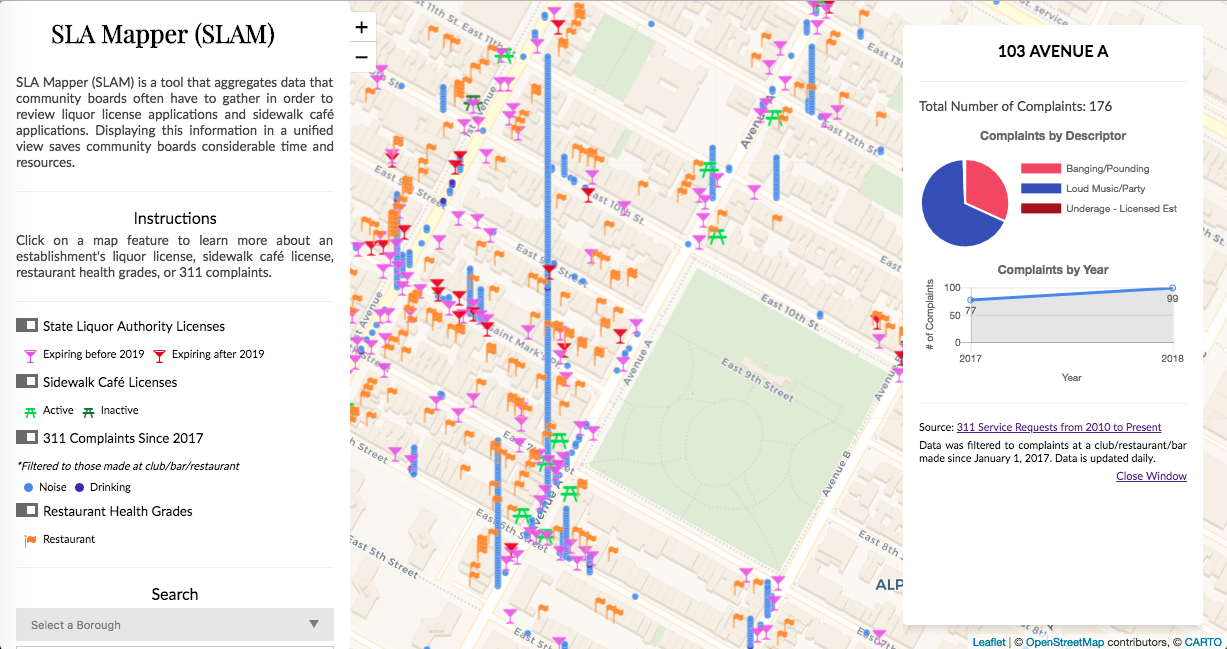
Monitoring the Issuance of After-Hours Variances
To conduct construction work on the weekends or beyond the hours of 9AM to 5PM, a development company must receive an After-Hours Variance (AHV) permit from the DOB. Over the past decade, there has been growing concern amongst residents, community boards, and other city officials that the DOB is distributing these permits too liberally (often in response to pressure from many external forces to quicken the pace of new development).[55]
Bob Gormley, District Manager of Community Board 2, described the need for more accessible data about the number of AHVs the DOB issues, along with the reasons that they issue them. He described during our interview:
The issuance of After-Hours Variances by Department of Buildings to contractors has been one of the main gripes of constituents to community boards, and I’m sure elected officials hear in their offices as well. A building gets razed, and suddenly the jackhammers, and the backhoes come in, and construction workers are there every night, seven days a week. People who live across the street can’t sleep anymore, and we start to get complaints, and we start dealing with DOB, and, it seems to me (but I think a lot of other district managers would agree with me) like the Department of Buildings … approve these applications and issue these permits much too readily, much too liberally, and they’re not really factoring in how it impacts people who live right there.
Currently, to get to records of the After-Hours Variances permits that the DOB issues, individuals need to know the address of a building and enter it into the DOB’s BISweb.[56] At the bottom right hand side of the resulting page, there is a link to the After-Hours Variances issued for the property. The DOB publishes several datasets that document construction applications and awarded permits on the City’s Open Data Portal, but these datasets do not include AHV permits.
Gormley noted that it would be useful to him to know how many After-Hours Variances have been applied for in his district over a period of time and how many have been approved. He went on, “if the approval rate is 98%, that says something.” Josh Thompson, Assistant District Manager of CB2, noted that it would also be useful to know the saturation of AHVs issued on a given block in a certain time period. Being able to visualize issued AHVs on a map would enable them to show DOB the impact that construction activities and other events may be having on nearby community members. Finally, Bob Gormley noted that having data about AHVs more accessible might help community boards audit applications. He referenced a lot in his district that has been vacant for several years. The owners lease it out as an event space several nights a week, and in April 2018, the DOB issued an AHV permit for the lot for two weeks straight, 7 days a week, 24 hours a day. Residents live in a building across the street, and one resident emailed the community board office with screenshots of the DOB online records for the permits issued to the building, showing that the permit holders had responded to the application question “Are there any residents within 200 feet of this location?” by checking the “No” box.
Since it is currently only possible to search for AHV permits on an address-by-address basis, the district office would have to search for every address in the district to find out how many applications have come in to DOB, to find out how many have been approved in the district, to map the data, and to check how often applicants are responding truthfully to the question about the building’s proximity to residents. This would be prohibitively time-consuming.
Opportunities for Improvement
- Recommendation 1: Ideally, After-Hours Variances data should be published online, in a machine-readable format, and updated daily.
- The dataset should list every record for an issued AHV application, along with the status of the application and the BIN of the building under consideration.
- It should also include the responses to certain application questions such as the reason the AHV is being applied for and issued, and whether or not the building is within 200 feet of a residence.
- It would then be possible to join this dataset with the DOB’s Building Footprint dataset[57] and map the AHV applications, showing the percentage awarded, the saturation of those awarded in certain locations, and how close each is to residential buildings.
- Recommendation 2: Further, the DOB should publish a shapefile that displays not only current building footprints, but also the footprints of vacant lots that still have BINs and buildings under construction that already have BINs. Without this it is difficult to map all the places in the City that may have been awarded AHVs.
What BetaNYC Has Done
At BetaNYC we submitted a request for this dataset to the City’s Open Data Team and had a chance to engage directly with DOB on making the data available. They told us that, while their data release list is currently extensive, they will keep us in mind as potential collaborators when they are prepared to release the data. We also supported the Manhattan Borough President in sending a letter to the DOB, urging them to make this data available.
In the meantime, we pulled together every BIN in Manhattan Community Districts 1, 2, and 7, wrote a Python script to enter each BIN into BISweb, and scraped the data about every AHV that has been awarded to each BIN in the two districts. We scraped information such as the dates the AHV was awarded, the business to which it was awarded, the reasons it was awarded, and the number of days it was awarded. We also scraped applicants’ responses to the question “Is this site within 200 ft of a residence?” Using the data visualization software Tableau, we then created a dashboard[58] that mapped out the AHVs awarded in the two districts. Using the dashboard, users can track how many variances have been awarded to a building over a certain period of time and compare that to the number of after-hours construction noise complaints made to 311 about the same location. There is also a page in the dashboard to check how applicants responded to the question “Is this site within 200 ft of a residence?” for each building. We found that, for many buildings, some applicants will respond ‘yes’ to the question and some will respond ‘no’, suggesting that many applicants have responded incorrectly and that the responses are not being audited.
There are also dashboard pages to track the reasons AHVs have been awarded to a building over a certain period of time and the number of applications that the DOB has denied or revoked. The dashboard equips community boards and district offices with the numbers that they need to advocate for better governance and provides a proof of concept of the kind of community oversight that could be provided if the data were made public.
Scraping this data for every district in the City would be time-consuming and would have to be done on a regular basis to keep the dataset up-to-date. At BetaNYC, we encourage DOB to make the release of this dataset a priority. We also encourage elected officials to ensure that the agency has the proper resources and budget to meet the open data mandates, especially as they are in the process of migrating to their new digital filing system, DOB NOW.
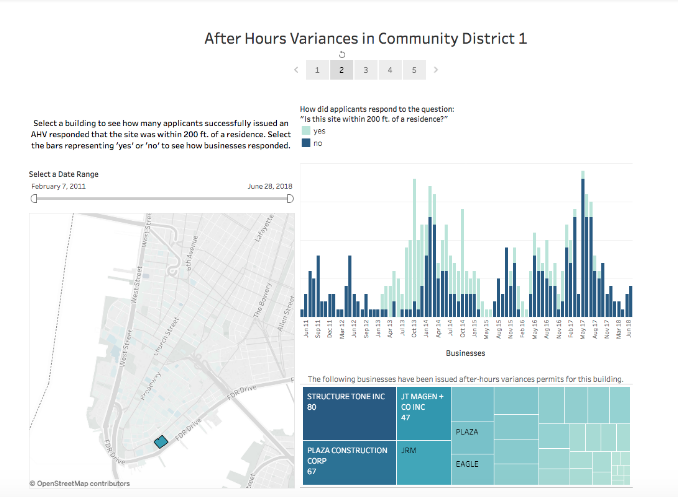
Monitoring Rent-Stabilized Units and Tenant Displacement
In 2017 district needs statements, many community boards in New York City identified the preservation and expansion of affordable housing options as the most pressing issue affecting their district. In particular, many community boards lamented losses of rent-stabilized units — due to building demolitions, buildings phasing out of city and state subsidy programs, building owners harassing tenants out of their units, and other decontrol policies. Many community boards are taking steps to counteract this, including supporting legislation to protect the stock of rent-stabilized units, supporting legislation to close owner loopholes, encouraging the City and the State to better enforce existing laws, and reporting cases of tenant harassment to HPD. In cases where community boards have an opportunity to provide input on a new residential construction, they often consider the percentage of units that will be rent-stabilized when deciding whether to vote yes or no on a resolution. However, many community boards do not know the location or number of rent-stabilized units in their districts.
Will Brightbill, District Manager of Manhattan Community Board 8, outlined how his board could make use of data about the number and location of rent-stabilized units, including how many units within individual buildings remain designated as rent-stabilized, what their rents are, and how many units are being warehoused/siloed for development. He described how the data would help when his board is making a decision about how to vote on a land use applications:
This is something that I’ve heard complaints about when folks are fighting new developments in their community. The new building will have, for example, 15 affordable units in it. You’ll hear from some, “the walk-up buildings that are being replaced had all rent-stabilized apartments in them,” but you recognize that in Manhattan that’s likely not true. But we don’t know. We don’t know if those buildings had 15 rent-stabilized apartments out of what might have been maybe a 40 unit building or buildings — meaning the developer was replacing the current affordable housing stock with something more permanent — or if the community was losing affordability in deal. How many affordable units you’re actually losing vs. how many affordable units you’re gaining? We don’t actually have access to that data, but I think this sort of data would be very helpful when you’re discussing whether to vote yes on a rezoning.
Currently, there are two ways to look up whether a property contains rent-stabilized units. First, New York City’s Rent Guidelines Board compiles information about the building registrations filed with the New York State Homes and Community Renewal to publish a PDF list of all buildings throughout each borough containing rent-stabilized units. The PDF includes information about the location of the building and the rent-stabilization programs in which the property owners participate. This PDF can be found on the NYC Rent Guidelines Board website.[59] The second way to look-up whether a property contains rent-stabilized units is through the property’s tax bill. NYC tax bills include the number of rent-stabilized units within a building for a given tax year, in addition to the programs in which the property owners participate. Tax bills can be looked up on the NYC DOF website by entering a building’s BBL and following links to each year’s tax bill. In both cases, the number of rent-stabilized units needs to be looked up on a building-by-building basis, making it difficult to develop a picture of affordable housing concerns district-wide.
Cody Osterman, a staff member at Manhattan Community Board 6, described how having a more comprehensive dataset could help his board conduct a study on affordable housing in his district. Specifically, he described the difficulty of finding data listing all buildings with a 421a[60] status. Since 421a is technically a tax exemption, the DOF handles the tax components. However, the Department of Housing, Preservation, and Development (HPD) approves 421a applications. Osterman tried for a while to work with both agencies to find a dataset that could support the study:
Is there a data set somewhere of all of this by community district? And not just this, I wanted to know what they’re doing to qualify for 421a, which is far more important. The list itself is pretty useless. You need to know if it’s a condo, if it’s a co-op, if it’s a rental — what are they doing to earn the exemption. … [Also] to find out: for your exemption you’re getting five units at X-AMI, five units at Y-AMI, and for how long. And what the status of those are, so we can have an accurate representation. You may have offered it the first cycle and that tenant left after three years. How do we make sure that the next time … that place is vacant, it’s still at that affordability level?
Ultimately Osterman was directed to aggregate the data by sorting through a few hundred pages of scanned PDFs per building on DOF’s Automated City Register Information System (ACRIS).[61]
Opportunities for Improvement
[perfectpullquote align=”right” bordertop=”false” cite=”” link=”” color=”” class=”” size=””]While making this dataset publicly accessible could promote transparency around affordable housing in the City, we also recognize that any form of information disclosure can lead to unanticipated shifts in regulatory, social, and political forces.[/perfectpullquote]Currently, the City does not put out a machine-readable dataset listing the location or number of rent-stabilized units for each property in the City, making it difficult to map where the properties are located and to track changes in rent-stabilization over time. Civic hacker John Krauss has made steps to make this data more accessible — downloading the tax bills for every property in NYC, scraping the PDFs to collect the number of rent-stabilized units, and publishing the data to a website called taxbills.nyc.[62] However, gathering and preparing this data for publication is extremely time-consuming. While making this dataset publicly accessible could promote transparency around affordable housing in the City, BetaNYC also recognizes that any form of information disclosure can lead to unanticipated shifts in regulatory, social, and political forces.[63]
- Recommendation 1: The City should begin to identify experts in this area and allocate resources to convene conversations around the ethics and pragmatics of making rent-stabilized data more accessible.
What BetaNYC Has Done
At BetaNYC, we have scraped the PDFs listing rent-stabilized units throughout the City put out by the Rent Guidelines Board. We then designed Tenants Map — a map that displays the location of rent-stabilized units throughout Manhattan. The map separately highlights the properties listed in the Rent Guidelines Board dataset and the NYC tax bill dataset scraped by John Krauss, allowing users to compare the accuracy of the two datasets. When users click on a property, they are provided with additional information about the property owner, the rent-stabilization programs in which the owner participates, and the number of rent-stabilized units in the building from 2007 to 2016. Users can also see the number of housing-related 311 complaints made about the property since 2015 — including those made about heat/hot water, plumbing, paint/plaster, rodents, dirty conditions, and elevators. Finally, users can filter the map to display only the properties in a particular community district.
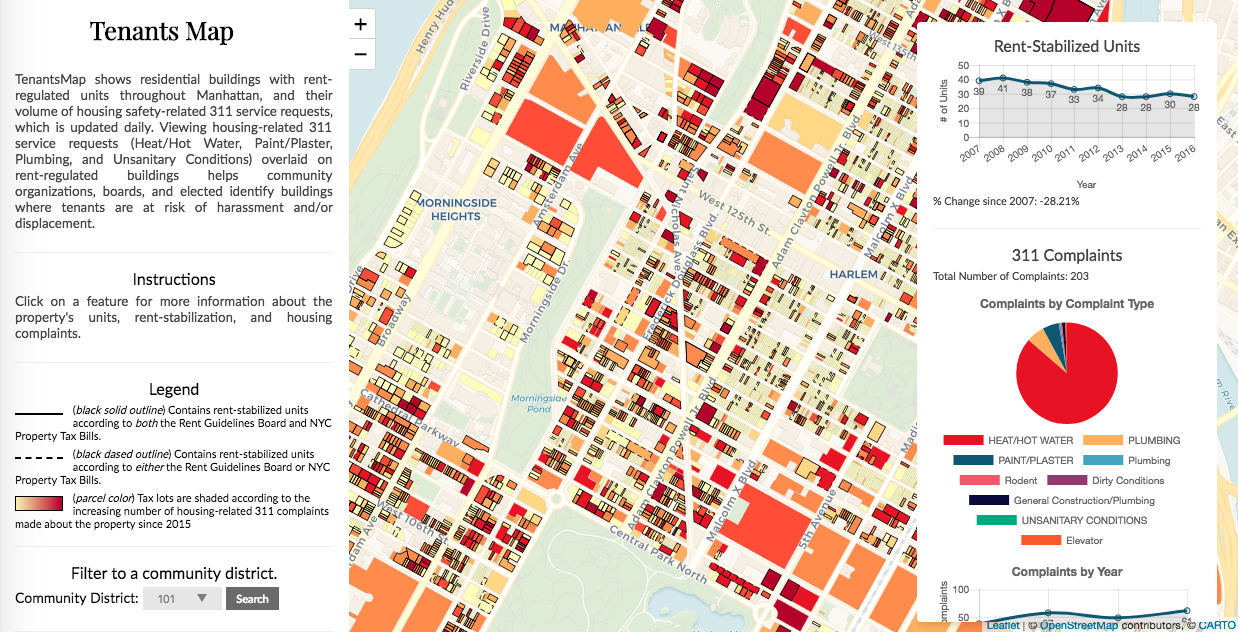
We encourage community boards to leverage Tenants Map when residents call district offices with housing-related concerns. The tool can can help them identify buildings where owners may be harassing rent-stabilized tenants out of their units to make way for high-rent leases. This can help district offices discern whether the complaint should be elevated to an elected official or to HPD. Further, in highlighting potential displacement practices, elected officials can use Tenants Map to inform policy for housing regulation. Civic technologists can contribute new features via the tool’s GitHub page.[64]
Tracking Street Closures
There are a number of reasons streets get closed in the City — for construction, road repairs, parades, film shoots, farmer’s markets, street fairs, and other special events. Both Manhattan Community Board 2 and Manhattan Community Board 6 noted the need for easier access to data about impending street closures in their districts. Bob Gormley, District Manager of Community Board 2, noted that his office constantly fields calls from the community complaining about street closures. He described an instance where Howard St. was closed for an extended period of time for various shoots:
People were going ballistic because there was either a movie shoot or a TV shoot or a model shoot, and it was the businesses more than the residents down there saying, “We can’t get our trucks in; we can’t make our deliveries. We can’t get trucks down our blocks.”
Gormley explained that the Mayor’s Office of Media & Entertainment will send him information about an upcoming film shoot before it happens, and that he will do his best to forward that information to the communities that will be affected:
If it’s a block that I recognize as having a block association, I forward it to [the affected communities] so they know what’s going to happen. We only get them like a day or two or three in advance, but I want to let my constituents know the streets that will be impacted, including the removal of parking spaces on adjacent blocks, so they can make necessary accommodations.
Jesus Perez, District Manager of Manhattan Community Board 6, described how he has been working to develop a map to live on his website that can alert the community of impending street closures:
We would be able to customize it so that if a street is going to be closed for a crane operation, for example, we’d be able to highlight it in red. We’d be able to have a box that pops up that indicates, “This is what work is being done here. This is how long it should take. This is the person you reach out to about this project. Here’s a picture of the condition.” So that we could represent all the private and municipal infrastructure projects in our district in one place, so it’s easy for community residents to see. Right now we only have, on our website, a written list of all these projects. An interactive map, however, would offer us a visual representation of all the projects in our district and would enable us to clearly show agencies who seek to undertake more projects in our district that we may already an over-concentration of projects in our area and that adding more would adversely impact quality of life.
There is open city data to support this type of mapping effort. The DOT publishes data about street closures due to construction activities, and the CECM publishes data about street closures due to permitted events. Both include geographic information and are updated daily on the City’s Open Data Portal. DoITT has used this data to create a map that enables individuals to check the street closures on a given day throughout the City.[65] However, Gormley and Thompson noted that while it can be useful for residents and business owners to check whether their street will be closed on a particular day, the district office and community board would like to track how many times a street has been closed over an extended period of time. Knowing this he argued would enable the district office to assess the impact of street closures on residents and businesses and could help them advocate for those who have been disproportionately impacted. DoITT’s street closure tool does not summarize the data across time spans however; it only displays the data for a particular day.
Opportunities for Improvement
Each community board throughout New York City should be able to display a map of impending street closures on their website. This map should ingest open data reporting impending street closures from the DOT and from the CECM, but it should also enable district offices to contribute additional events where they know traffic or parking will be impacted. The map should provide reports such as the total number of days and hours a street segment has been closed over the course of a year and a breakdown of the reasons it has been closed. However, because of the way that permits get distributed, producing such a map would be difficult. A DOT street construction work permit can be issued to cover a span of several weeks, and in many cases, the street is not closed the entire span of the permit. Reporting accurate counts of the number of days a street segment has been closed for construction is impossible based on just this dataset. Further, street closures for permitted film events only appear in the CECM dataset if an event is going to impact a street for more than five days.
Tracking the Number of Sanitation Workers and Frequency of Collection
While not brought up explicitly in any of our interviews, many district needs statements reported the need for better data about the number of sanitation workers in a district. More specifically they noted that the number of sanitation workers devoted to the district is not consistent with the tonnage of garbage the district produces. Manhattan Community Board 10’s district needs statement reported:
With the redevelopment of City-owned properties and an increase in the residential population and commercial establishments, the Community Board believes that Sanitation staffing has not kept pace with the need to process the additional waste tonnage. Cleaner streets are necessary because CB10 continues to hear from community about the amount garbage. As stated above, the more focused and thorough of the collection of garbage and trash and the cleaning of streets has impacts the health and well-being of the businesses and residents of our District. Health and Safety: CB 10 has heard from community residents, block associations and business owners of the need to do a better job within the District of addressing the issue of rodent infestation. All agree that more frequent trash collection is critical to this process and further suggest a targeted program of replacing existing trash cans with tamper proof versions to prevent encroachment by rats and in some instances raccoons.
As a result, public trash cans are often overflowing, attracting rodents and pests. Community boards would like to have better data about the number of sanitation workers in their districts and along each route so that they can advocate for more frequent and consistent trash pick-up in district needs statements.
Opportunities for Improvement
DSNY publishes a dataset reporting the tonnage of garbage picked up in each community district each month. They also publish a dataset reporting the frequencies of trash pick-up in each sanitation district and the location of public wastebaskets. However, there is no way to check the number of sanitation workers allotted to each district, making it difficult to justify that sanitation staffing has not kept pace with garbage tonnage.
- Recommendation 1: DSNY should publish a dataset reporting numbers of garbage collection staff in each sanitation district.
What BetaNYC Has Done
At BetaNYC, our fellows designed a “Data Journey” around sanitation-issues. Data journeys walk users through using a series of municipal tools that visualize city or state data to investigate a particular issue. For this data journey, analysts first look up the top locations for sanitation complaints (about overflowing litter baskets and missed collections for example) made to 311 in their districts. They then check DOHMH’s Rat Information Portal[66] to check the results of rat inspections in these locations. Finally, analysts check the 311 complaints about rodents made at a particular address. Following these steps provides users with a broader picture of sanitation and rodent issues in their districts. We encourage community boards to practice with this data journey (along with others that BetaNYC has published) in order to get acquainted with different data visualizations and dashboards the City has produced.
| Challenges | |||||||||
| Data hasn’t existed or is inaccessible. | Data hasn’t been up-to-date or timely. | Data geography has been incommensurable with community districts. | Data categorization has been incommensurable with community problems. | Boards and district offices have lacked data infrastructure. | Boards and district offices haven’t had time. | Board and district offices have known that data has gaps and biases. | Boards and district offices have been unaccustomed to working with data resources | ||
| Use Cases | Tracking Crimes at Establishments via 911 Calls | x | x | x | x | x | |||
| Analyzing Pedestrian Foot Traffic on Sidewalks | x | x | x | x | x | ||||
| Understanding Community District Health | x | x | x | x | x | ||||
| Monitoring Illegal Parking in Bus Lanes | x | x | x | x | x | ||||
| Tracking the Location and Saturation of Vacant Storefronts | x | x | x | x | x | ||||
| Aggregating Information to Prepare for SLA Applications and Renewals | x | x | x | x | |||||
| Monitoring the Issuance of AHVs | x | x | x | x | x | x | |||
| Monitoring Rent-Stabilization/Displacement | x | x | x | x | x | ||||
| Tracking Street Closures | x | x | x | x | x | ||||
| Tracking the Number of Sanitation Workers and Frequency of Collection | x | x | x | x | x | ||||
Summary of Data Needs
To advocate for their communities and effectively participate in municipal processes, community boards need better access to information. While the City’s Open Data Law and the State’s Executive Order have enhanced public access to geographic data, complaint data, and other important municipal datasets, there remains a large gap in the ability of community boards to effectively make use of this information. The challenges to advancing data practices in community board workflows are notably not just technical; there are also infrastructure challenges, literacy challenges, systemic challenges, and cultural challenges. In addition to the specific opportunities for improvement we identified in previous sections of this report, BetaNYC has also identified several overarching data needs that can help scaffold community board data access and literacy.
1. Data literacy training
Community boards need training on multiple topics related to data literacy, including data access, data analysis, the use of data analysis software (such as Excel and RStudio), and the use of data visualization software (such as Carto, Tableau, and GIS software). They also could greatly benefit from more conceptual data training on topics such as the history of the open data movements, data governance, data bias, and data ethics. Finally, community board members should receive training on basic statistics principles, so that they can gain exposure to best practices in data collection and anticipate issues and biases that may affect the reliability of the data they reference. Such trainings should have offerings on days, nights, and weekends to accommodate diverse schedules, and they should be recorded and made available online for those unable to attend.
2. Tools to synthesize data
In general, community boards need access to better tools and maps that synthesize data into a digestible form. We have outlined technical specifications for several of these tools in previous sections of this report. City agencies should collaborate with community boards when planning such tools to better understand and design towards their specific data needs.
3. Technical data infrastructure
Community boards need high-speed internet in order to download data. They need updated computers in order to run many data software packages. If they want to share data visualizations online, there is often a limit to the capacity of files they can host before having to pay monthly storage fees. Overall, community boards need better technical data infrastructure in order to support their work.
4. Staff with data and technical expertise
Community boards need resources to hire staff with data and other forms of technical expertise, and particularly individuals that understand and value free software. Having staff devoted to this kind of work takes pressure off of already time and resource-strapped district offices, and it also ensures that district offices are equipped with a set of skills that enables them aggregate and query data resources. Finally, it ensures that they have expertise on hand to audit data analyses presented to the community board by developers, business owners, and City agencies. In the near-term, shared staff models where individuals with data expertise work at different offices on different days (paid on a part-time basis by each) may be an appropriate transitional solution.
5. Data support
Currently, when community boards need data support, there is no formal point person to whom they can query. Sometimes they will reach out to representatives at their Borough President’s Office for help, and at times, they have asked BetaNYC for help with discrete data analysis tasks. Community boards need designated data support processes (in addition to the resources to learn and conduct data access and analysis on their own) that are not tied to the Mayor nor to City Council.
6. Procedures for requesting information infrastructure
Community boards should be able to cite their needs for technical and information infrastructure directly in their district needs statements. This would publicly display community board’s technical needs in the same way community boards currently articulate their needs to other agencies, and it would scaffold relationships between community boards and DoITT in a more systematic way. The Manhattan Borough President’s Office and BetaNYC have sent recommendations to DoITT to work with DCP and the City’s Office of Management and Budgeting (OMB) to create a process for community boards to record their technical needs in district needs statements.
7. New collaborative data design protocols
Community boards and the public deserve a seat at the table when agencies are planning to package and release data. They often have pertinent insights about how the data should be categorized, ordered, and geocoded to best serve their communities. The City should formalize protocols for collaborative data design.
8. Open algorithms
In October 2017, City Council Member James Vacca introduced a bill that would become Local Law 49[67] — requiring that the City establish a task force to research the fairness and equitability of the City’s algorithms. In December 2017, BetaNYC provided testimony on the NYC Algorithms bill,[68] and in January 2018, BetaNYC co-signed a letter to Mayor Bill de Blasio, listing recommendations for the composition of the task force.[69] In May 2018, Mayor de Blasio announced the task force. NYC stakeholders publishing open data need to be more transparent about the processes by which data is produced, categorized, analyzed, and consumed. Making the details and inner-workings of computer-automated decision-making systems more accessible to the public can help community board members and staff better understand how data systems are impacting their communities and constituents. Giving them the resources and skills to review those systems can empower them to question and audit systems of governance that misrepresent the problems their communities face.
Recommendations
Community Boards: Advocate for Improved Information Infrastructure
1. Explore opportunities for professional development around data literacy
Community board members and staff do not necessarily all need to become expert data analysts. However, it is important that they have exposure to basic data concepts so that they can responsibly cite census data, make use of city data dashboards, and unpack some of the ways in which systems of data collection and analysis are imperfect. To advance their understanding of data issues, community board members and staff can participate in open data trainings offered by BetaNYC, their Borough Presidents, or the City’s Open Data Team. They can participate in School of Data — an event BetaNYC hosts each year (in March) that offers panels and workshops that explore the use of city data tools. They can also begin getting acquainted with data dashboards city agencies and civic technology organizations have designed to make data more accessible. Some of these dashboards have been made available on the City’s Open Data Portal,[70] and others can be accessed from city agency websites.[71]
2. Submit data requests on the Open Data Portal
Community boards can submit formal requests for specific datasets to be made available to the City’s Open Data Team through the City’s Open Data Portal.[72] They can also provide feedback to the State’s Data Working Group by submitting feedback on the State’s Open Data Portal.[73] When submitting this form, community boards should be specific about the question they are trying to answer with the data in order to specify a compelling use case for making it public.
3. Design metrics for gauging impact of information practices
It is important to ensure that new information practices are helping community boards and not just creating more burdens or diverting attention away from more important tasks. Before evolving their workflows, community boards and district offices should set metrics to verify that digital information practices actually make their work more efficient or actually improve their communication with their constituents and city agencies. Such metrics may include how much time the office saves by using information tools or indications of a change in the impact of the community board’s resolutions based on the inclusion of new data references.
4. Solicit diverse staff skill sets
When hiring district office staff, community boards should consider a candidate’s skill or experience in working with data resources. Skills that are relevant to the type of work outlined in this report include experience with Excel, GIS, data visualization, or various programming languages. Candidates with backgrounds in statistics, computer science, information technology, library science, or data science can offer a unique and critical set of skills to district office operations. Other relevant skills might include database management or graphic design.
5. Communicate with city council members, the technology committee, and Borough Presidents about the need for improved information infrastructure
Community boards’ capacity to purchase infrastructure, devote time to training, and hire technical staff is dependent on them receiving additional budgetary resources. It is important that elected City officials understand the value of information infrastructure in supporting local government practices and that they prioritize these needs in drafting budgets. Community boards should communicate the need for these types of resources with their elected representatives.
6. Leverage free data software solutions
There are many free data software packages that community boards can leverage (See Appendix). For example, QGIS is a free and open source GIS software package that offers many of the same mapping capabilities as ArcGIS. RStudio is a free and open source software environment for manipulating data with the statistical language R. Tableau Public is a free data visualization software package that enables users to create data dashboards. Community boards should leverage these tools for data analysis rather than purchasing expensive licenses.
Civic Technologists: Engage in City Data Governance
1. Engage with community boards
To ensure that civic technology design is collaborative, representative, and responds to specific community needs, civic technologists need to find avenues to interface with and engage in local city governance. Civic technologists can attend community board meetings, apply to be on their community board, or inquire with your local community board whether it is possible to join as a public member. Community board meetings provide a great opportunity for civic technologists to learn more about the issues facing their communities and to begin to scaffold relationships with city government. Civic technologists can attend and participate in these meetings. Civic technologists can also learn more about local issues and opportunities for addressing them by reading community board district needs statements.[74]
2. Research the contexts in which the City is producing and consuming information
In order to effectively participate in city governance, it is important that civic technologists understand how city data is produced, managed, and consumed. For the most part, city agencies have done a good job of documenting their data collection practices and their data schemas on their websites and in their data documentation. The City’s Open Data Team has made legislation around Open Data and annual reports on the Open Data Plan and Open Data for All Initiatives available on the City’s Open Data Portal.[75] Civic technologists should read through this documentation and reporting to familiarize themselves with how the City is managing and governing its data resources.
3. Submit requests for data quality improvements on the Open Data Portal
Working with city datasets regularly, civic technologists are more likely to pick up on errors. They also can provide compelling use cases for why certain fields may be needed in a dataset. The best way to communicate these concerns with the City’s Open Data Team is to submit issues on the City’s Open Data Portal.[76] Doing so can help start conversations that improve data quality, not just for civic technologists, but also for community boards. Individuals can sign up for the Open Data Mailing List and can create an account to receive notifications about updates to datasets on the portal.[77]
4. Participate in technology hearings and participatory budgeting
Community members can attend City Council meetings, including meetings for the Committee on Technology. These meetings provide a great opportunity for citizens to learn about how the City is addressing technology needs and budgeting for technology infrastructure. In attending these meetings, civic technologists can advocate for funding better information infrastructure and public data literacy. Civic technologists can also have a direct impact within the City’s budgeting process by attending participatory budgeting meetings and sharing their ideas for how discretionary funds should be allocated through online tools.[78]
5. Participate in the City’s Charter Revision processes
The New York City Charter acts like a constitution for the City — outlining the structure and responsibilities of New York City government. This year, Mayor Bill de Blasio convened a Charter Revision Commission — tasked with reviewing the entire charter, holding public hearings to collect input on the charter, and setting out recommendations for revisions.[79] This commission is coming to a close, and New Yorkers will have an opportunity to vote on three proposed revisions to the Charter this November.[80] More recently, a second revision commission was convened by City Council, in collaboration with Borough Presidents, the public advocate, the city comptroller, and the mayor. There are several ways to get involved in the second revision process. The Commission is currently collecting public comment in the form of written testimony.[81] They are also holding public hearings in all five boroughs.[82] Civic technologists can participate in the process to advocate for better equipping community boards and other City agencies with the information infrastructure they need to better respond to constituent concerns.
6. Plan and participate in hackathons and data jams that address real use cases
Civic technologists should seek out opportunities to participate in civic technology events that bring together elected officials, representatives from city agencies, local government stakeholders, and community members to design solutions that address real issues. When organizing such events, they should seek out compelling use cases from community boards and other local organizations and should ensure that a diverse mix of stakeholders and skill sets are in attendance. City events like these are often advertised on the NYC Civic Technology, Design, & Open Government Facebook page[83] and referenced in the BetaNYC newsletter.[84] The City’s Open Data Team hosts several events at Civic Hall[85] and during the City’s Open Data Week.
City Agencies: Practice Critical Data Design
1. Hire and support technology and data leadership
NYC agencies need representatives in leadership to plan, implement, and advocate for smart technology and data policies and practices. Agencies should appoint and support Open Data Coordinators that can help agencies get in compliance with City Open Data standards, manage data resources, and plan for critical, collaborative, and user-centered data design practices.[86] Agencies need to prioritize the budgetary resources that Coordinators need to effectively package and deliver datasets and need to set aside resources to enable them to perform public outreach. Agencies also need to ensure that these staff members have the time they need to conduct this work effectively.
2. Design dashboards and maps to make data more accessible
Several NYC agencies have designed and made publicly available dashboards and maps that visualize their datasets. Having such tools available takes pressure off of community boards to develop expertise in data analysis and visualizations. Further, when agencies create these maps in-house, they have the opportunity to structure information in ways that ensure that those viewing the data interpret it in an appropriate context. However, it is important that, when agencies design these tools, they consider the questions the community members need to ask with the data and the decisions they need to make with the data. To design dashboards and maps that will be useful to the public, city agencies designing these tools should engage with community boards, aiming to better understand their workflows. Some agencies (such as the Department of Parks and Recreation[87]) are already doing this well, and we hope that their work can serve as a model for others.
3. Provide robust documentation of data and data practices
To support the public in interpreting data in responsible ways, it is important that the City agencies publishing data include rich descriptions of what they know about the dataset. In addition to the field definitions that are typically included in a data dictionary, City agencies should include narrative descriptions of how the data gets collected and how categories get divided, along with any known biases in the data. City agencies should also better document their data practices, including information about the public and private stakeholders with whom they collaborate around data production and analysis. The Open Data Team’s Metadata for All Initiative has made notable strides in this direction. In the summer of 2018, a team of data librarians, in collaboration with the City’s Open Data Team, reviewed 100 city data dictionaries and interviewed representatives at city agencies in order to scaffold recommendations for making data dictionaries more accessible to diverse users. They recommend that each dataset on the Open Data Portal have a usability guide that offers narrative description of the context in which the data was created, in addition to descriptions of the fields. At BetaNYC, we hope to see the design of these guides become standard practice for Open Data Coordinators. However, we also recognize that this is a time and resource intensive process. To describe and define data fields at a basic user level, Coordinators need to meet with subject matter experts in their agencies — eliciting information about data workflows, breaking down jargon to colloquial language, and documenting what they learn for users. Elected officials should ensure that agencies have the budgetary resources to make this work possible.
4. Improve 311 data reporting
While the publication of 311 data has greatly improved community boards’ capacity to query when, where, and why NYC residents are requesting service, the multiplicity in how City agencies report data back to 311 has made it difficult to use the data as a tool for supporting constituent services. City agencies should work to standardize their interpretation of 311 status categories and to provide more informative descriptions of resolutions. City agencies should publish definitions of complaint types and descriptors and explain the differences between seemingly related complaints (e.g. ‘Noise’ as reported to NYPD vs. ‘Noise’ as reported to DEP). Community boards should be involved in these design processes.
5. Elicit diverse community input and auditing
Living and working in the areas city and state data represents, community board members are perhaps the best auditors of data about their communities. They can identify the problems in their communities for which there should be data, and thus can make important contributions to conversations around best practices in data collection. They can also tell when something is off in a city or state dataset, and they often can outline how biases in the data could have emerged. Open Data Coordinators should be enlisting community boards as collaborators in data auditing, eliciting their community expertise when designing data schemas, and incorporating their insights and concerns in their data documentation. In collaboration with civic hackers across the City, BetaNYC has come to understand this as a need for a user-centered data release workflow[88] — modeling user testing workflows that accompany software product development. Open Data Coordinators can engage community boards in this type of workflow.
6. Attend to challenges at multiple scales
Making data publicly accessible is just a first step to better engaging community board members in city governance. To be able to make use of that data, community boards need access to digital infrastructure, time, staff, financial resources, and training.[89] Too often, challenges at these higher scales are ignored in the process of opening city and state datasets. Agencies invest a great deal of time and resources in making the data open when community boards (and other community members) do not have the capacity to do anything with them. It is thus important, when working to advance community board access to city information, to consider information practices in the broader context of community board work. Agencies should not just seek to support data release but also to support community boards’ infrastructure and literacy needs. Open Data Coordinators at individual agencies should prepare public training on how best to use their own data resources, helping to unpack some of the biases that may arise from other’s interpreting the data without context. DoITT should also be involved in conversations regarding what affordable technical infrastructure can best support data work at the community board level.
7. Acknowledge the limits and probe the biases of data analysis
Analyzing and visualizing city and state data offers new insights into a city’s landscape. At times, it makes it possible to grasp complex issues and see patterns that were impossible to see without synthesizing the information into a digestible form. However, data collection is never fully comprehensive, and data analysis is never fully objective. Any data visualization offers just one of many views into what is going on in a city. Ignoring the limits of data analysis or placing too much faith in data to speak for itself can harm populations that get excluded from or misrepresented in the data. It is important that all stakeholders in NYC government be sensitive to these limits of data analysis even as they advance their capacity to leverage it in decision-making and advocacy. All stakeholders should actively probe the biases of data — examining gaps in how data is collected, confronting prejudices in how data gets categorized, and comparing the diverse stories data can tell as it is visualized in alternative ways. Doing this well will require diverse community input. Notably, most of the community boards that we have spoken with are acutely aware of the dangers of relying on data alone to advance their work and can speak to the ways in which the City’s information resources should be thought about in broader contexts.
Conclusion and Enduring Questions
For the past 10 years, BetaNYC has been committed to advancing a sustainable, resilient, and equitable civic technology ecosystem that can support civic engagement and foster a more inclusive and honest government. We believe that improving community board information infrastructure is integral to pursuing this goal. Community board members and staff have local community expertise and experience and direct connections to the neighborhoods they represent. Bolstering their technology and data capacity arms individuals well-positioned to represent community problems with the information they need to do so. We hope that the recommendations presented in this report can begin to address some of the challenges to improving community board information infrastructure. However, all the recommendations are contingent on agencies and community boards having the budgets and resources they need to implement new processes. We look forward to working with elected officials to address these issues and to think critically about legislation that can advance them.
With community boards serving as intermediaries between the public, city agencies, and elected officials, empowering them to access, review, and critique information can also help democratize the City’s systems of knowledge production — providing opportunities for local expertise to have a say in how information about the City and its citizens gets produced and consumed. However, the recommendations suggested in this report are just a first step towards this more ambitious goal. To realize this goal, further research questions to consider include:
- What are potential models for collective governance of the City’s data resources — where community boards are not just invited to audit data, but also to offer input on data collection, categorization, and management? What would it take to institute these models?
- How can we ensure individual data sovereignty — where the public can have a say in what and how information is produced about them? What role can community boards play in brokering agreements around data sovereignty?
- What are responsible and ethical ways to talk about the value of data and evidence (and to reference it in decision-making) when gaps and biases are always present? What are the discursive risks to initiating this conversation at a time when truth and evidence are under political attack at the national level? How should we respond to these risks?
- How can community boards and other local organizations intervene in systems of knowledge production that enable and incentivize powerful actors to silence marginalized populations by ignoring them in data collection, to profile marginalized populations by targeting them in data collection, and/or to discriminate underrepresented communities by misrepresenting through data analysis?
We hope that, in collaboration with NYC government, civic technologists, data advocacy groups, and the public, we can begin to tackle some of these enduring questions in the coming years.
Acknowledgements
- Alfred P. Sloan Foundation
- Manhattan and Brooklyn Community Board Members and District Office Staff
- Manhattan Borough President, Gale A. Brewer
- Manhattan Borough President’s Staff, including senior staff, land use staff, and community liaisons
- Brooklyn Borough President Eric Adams and Staff
- Mayor’s Office of Data Analytics
- Department of Information Technology and Telecommunications
- Carto
- Microsoft Cities
- Review panel, including anonymous reviewer, Cynthia Conti-Cook, Lilian Coral, Lucian Reynolds, Matt Stempeck, Andrew Young
Appendices
Sample Interview Questions
- What is your background? How did you come to have this job as a district manager, and how do you see your role in the community?
- What makes your community district distinct from other community districts in Manhattan? What makes your community board distinct from other community boards in Manhattan?
- Describe your board’s relationship with community members. Do you find that the board adequately represents the diversity of concerns within the community?
- Describe your board’s relationship with different city agencies.
- What sorts of expertise do your board members – particularly your board chair and committee chairs – bring to their work in the community board?
- What are the most time-consuming aspects of your board’s or office’s work? What makes these activities so time-consuming?
- What are some of the most common concerns that get voiced in opposition to proposals that come before your board? Does your board ever disagree with concerns voiced by community members during meetings? How do they work through this?
- When a ULURP [or a liquor license application or a sidewalk café application or a street fair application] comes before your board, what sorts of information do committee members factor into their decisions? How do they gather this information? [Several questions about this workflow would follow-up based on responses to these questions]
- If your board members needed additional information in order to put together a resolution or a report, would they gather this information on their own, or would they call your office to gather the information?
- Have your board members or office staff ever accessed the City’s Open Data Portal? If so, in what capacity? If not, what are some of the roadblocks to doing this?
- In what capacity can you imagine using (or do you already use) 311 service request data to better understand the needs and concerns in your community?
- Do you know if any of your board members make use of digital software or datasets put out by the City? Does your land use committee use ZoLa? Does your office use the Department of City Planning’s community profiles when putting together district needs statements? Does your office or the board use BoardStat? If so, how have these tools advanced the board’s work? If not, are there certain roadblocks towards using them?
- In what capacity does your office or your board reference demographic data? If your office or board needed to get demographic data, how would they get it?
- Can you identify certain datasets that are currently unavailable to the board that you believe would advance the board’s work? If so, what are they?
- Do you have any questions for me?
Sample Survey Responses
Data Success Stories
Mark Thompson, Manhattan Community Board 6 Member
Committee: Parks, Landmarks & Cultural Affairs
Describe the issue that came before your committee, district office, or council office:
CB 6 has a large number of POPS and most of them were compliant with regulations, which created problems such as exacerbating the District’s dearth of parks and open space. We wanted to do something about it. This was a grassroots effort that came about through member discussions.
What data or tools did you access to better understand or legitimize the issue? What steps did you take to access or analyze the data or the tool, and what were the findings?
We used a variety of data available through DCP and DOB that showed where plazas were built in return for development benefits; members reviewed what and concessions were required through POPS agreements, and members scoured the District on foot in groups or individually to identify the status of each POPS. We then published a report and have since updated it. This allowed for better enforcement and gaining the benefits to the community that should have been in place.
In what ways did the data or tool help you better understand or legitimize the issue?
We were able to identify each location and what amenity/etc should exist. It made it very clear what was wrong and needed to be resolved.
Do you have any suggestions for how the data or the tool could be improved?
The tools themselves were easy enough to use, just a bit time consuming. The DCP and DOB websites are easy to manipulate, so there is no real need. What would be good is to have a unified listing and map of POPS throughout the entire city so that each CB or neighborhood group could monitor compliance. Another improvement would be getting better enforcement and much stiffer penalties.
Chenault Spence, Manhattan Community Board 2 Member
Committee Name: Landmarks
Describe the issue that came before your committee, district office, or council office.
There is ongoing need to learn historical data about landmark applications, to know what submissions are in various stages and to know the resolution of applications by the Landmarks Commission.
What data or tools did you access to better understand or legitimize the issue? What steps did you take to access or analyze the data or the tool, and what were the findings?
The Landmarks Commission website is a joy and, with some training and experience, it is easy to navigate. Especially attractive and useful is a new interactive map that records all applications from January 2017 onward and it is updated daily. The archive is extensive and clear. I was able to find the designation report for a member of the public’s house in three minutes and pass it along to answer her query.
In what ways did the data or tool help you better understand or legitimize the issue?
Especially being able to find or verify historical data aids the Committee in being able to make sound decisions. It is also useful for the Committee to see the ruling of the Commission to better understand their reasoning.
Do you have any suggestions for how the data or the tool could be improved?
A vexing problem, especially in CB2 with its numerous historic districts, is identifying and tracking violations. The reporting is rather casual, usually as a result of a complaint, and easier access to reported violations and their tracking would be of great help to the Committee and the community.
Richard Robbins, Manhattan Community Board 7 Member
Committee Name: Transportation Committee
Describe the issue that came before your committee, district office, or council office.
In my opinion, the most important work that the Transportation Committee does is keeping our streets safe. Since joining CB7 and the Transportation Committee, I have been using NYPD’s open crash data to help the committee make smarter, data informed decisions about where we should focus our efforts, where the most dangerous intersections / corridors are in our district, and what actions might have the ultimate desired impact of driving down injuries / fatalities in our district.
What data or tools did you access to better understand or legitimize the issue? What steps did you take to access or analyze the data or the tool, and what were the findings?
I used NYPD’s publicly available crash data and analyzed it with Excel and, on occasion, Tableau. This has allowed me to identify the intersections and corridors in our district that have the most crashes, injuries and fatalities and to dig deeper to look by type of vehicle, person injured (motorist, pedestrian or cyclist), time of day, etc.
In what ways did the data or tool help you better understand or legitimize the issue?
We very often get complaints from citizens about perceived dangers on our streets. In my view, the committee prioritizes its actions based on anecdotes, rather than by strong analysis of data. The committee also hadn’t had a way of measuring success of changes, such as DOT’s redesign of 96th / Broadway, West End Avenue and the protected bike lanes on Columbus and Amsterdam.
Do you have any suggestions for how the data or the tool could be improved?
Much more information is needed to enable better analysis. For example, the publicly available data doesn’t show the direction that vehicles were traveling. So, for example, we don’t know if the many pedestrian injuries on Broadway (which is by far the worst north/south corridor in the district for pedestrians) are caused by cars turning left, going straight, turning right, etc.
Michael Noble, Manhattan Community Board 4 Co-Secretary
Describe the issue that came before your committee, district office, or council office.
The issue comes often when we consider new applications for full liquor licenses in Chelsea and Hell’s Kitchen.
What data or tools did you access to better understand or legitimize the issue? What steps did you take to access or analyze the data or the tool, and what were the findings?
I use NYC OpenData in all cases to determine whether there have been noise or other complaints associated with the address of the establishment in question and other establishments owned by the applicant. The data comes from the 911 database.
In what ways did the data or tool help you better understand or legitimize the issue?
This data is the only available source of the information we need to make a decision.
Do you have any suggestions for how the data or the tool could be improved?
The way that I share the data sets that I create is by sending a link to its page. It would be better if I could use the PDF creation tool that is available to people with greater privileges than mine. This is an example of a link that I would normally send: https://data.cityofnewyork.us/Social-Services/RUDY-S-COMPLAINTS/n2qe-a99b
Data Use Cases
Christine Berthet, Manhattan Community Board 4 Member
Committee Name: Business License committee
Describe the issue that came before your committee, district office, or council office.
We approved the liquor license for a bar with a number of stipulations. Then the community complained about noise etc. It is very time consuming to retrieve the stipulations; the public did not have access to it. NYPD did not have access to it.
Describe what kind of data would have helped you contextualize this issue.
Having a map, where you can click the location of the establishment, get the stipulations, some key data, and 311 calls in the vicinity (based on a variable time period) and possibly a link to the liquor license in SLA. Possibly link to the BIS system in DOB.
What challenges prevented you from using data resources to contextualize this issue?
- The data hadn’t been published in an accessible format.
- The data would have been time-consuming to access and analyze.
Elaborate on the challenges you selected above.
NYPD could not enforce stipulations they did not have. We had to search for them.
Do you have any specific recommendations for how this data should be structured, formatted, or displayed? If so, describe them below.
[Display a] map, with data entry field and opportunity to link documents. [Include a] field [… for]
various status[es] (proposed, approved by CB, approved by SLA.) Click buttons to retrieve stipulations, 311, SLA and BIS. Data entry fields should be connected to an excel sheet for database search. [Include a] search field for manager, owner, and lawyer to show other establishment they manage/own. [A] field should also be available for CB/NYPD to record complaints, actions, and resolutions.
Other Comments
We process 20 to 30 application every month. This is an enormous burden on the office and the various pieces of informations are disparate and hard to gather for the community and the CB. Then It is near impossible for the NYPD to enforce. Such a tool would alleviate the workload of all, improve communication, and improve ability of NYPD to enforce.
Susanna Aaron, Manhattan Community Board 2 Member
Committee Name: Social Services
Describe the issue that came before your committee, district office, or council office.
I’m trying to draw up a comprehensive list of social service providers in our district. The District Profile link seems updated, and provides a lot of good information. NYC has a beautiful map that includes a layer of social service providers. However, I’ve struggled to get that information in list form, which leaves me tediously going point by point on the map and hoping I didn’t miss a dot. I don’t know if this information counts as open data, or if is just a OASIS/ZOLA mapping question, however.
I haven’t tried my hand at getting additional data, some of which I think is probably available from Census/ACS sources — namely, demographic information on seniors living in poverty, on veterans, on levels of opioid addiction, on people with disabilities, etc.
Describe what kind of data would have helped you contextualize this issue.
I would like to know how I can obtain a list of social service providers in my district. Most of these, I imagine, are listed under current NYC mapping practices, as they have relationships with city/state agencies. But I also wonder if there are private not-for-profits that NYC’s mapping fails to account for.
Sheldon Fine, Manhattan Community Board 7 Member
Committee Name: Health and Human Services/ Inclusive Playground Task Force
Describe the issue that came before your committee, district office, or council office.
When we were were establishing the need for accommodating youth with disabilities, we were hampered by the lack of differentiated information about special needs students in our schools and others who reside in our community but receive education and services outside our community. Public School percentages of special needs students did not provide us with a breakdown of their type of disabilities. It was also hard to gather data on that information for youth served outside the local public schools — in other public school community school districts or in private and religious schools in and outside our district.
What challenges prevented you from using data resources to contextualize this issue?
- The data hadn’t been published in an accessible format.
Elaborate on the challenges you selected above.
The data we needed that differentiates between various student disabilities is not accessible publicly. The data for community residents or for other students in local public school was not publicly accessible.
Do you have any specific recommendations for how this data should be structured, formatted, or displayed? If so, describe them below.
Data for residents with disabilities should be available by age, geographic section of community board districts. public and private school.agency, and classification of disabilities (including multiple disabled individuals)
Marnee-Elias Pavia, Brooklyn Community Board 11 District Manager
Describe the issue that came before your committee, district office, or council office.
I heavily rely on data in formulating the board’s statement of district needs and recommendations to the capital and expense budget. Additionally, I use the data in day to day operations whether to monitor the delivery of city services or to provide information relating to a specific issue.
Describe what kind of data would have helped you contextualize this issue.
One issue that comes to mind is the ECB data set based on OATH Hearings Division Case Status. I have generated a calendar through Socrata to visualize the violations issued on any given day by Sanitation Enforcement Agents. The purpose was to determine if enforcement coincides with community complaints. Unfortunately, the data set uses a zip code and not a community district. This makes it difficult since zip codes overlap community districts.
What challenges prevented you from using data resources to contextualize this issue?
- The data would have been time-consuming to access and analyze.
Elaborate on the challenges you selected above.
In order to use the data I have to check each row to ensure that the zip code falls within the CB 11 boundaries.
Do you have any specific recommendations for how this data should be structured, formatted, or displayed? If so, describe them below.
The data does not have a field for Community District.
Tom Goodkind, Manhattan Community Board 1 Member
Committee Name: Housing Sub-Committee
Describe the issue that came before your committee, district office, or council office.
Understanding what affordable housing and stabilization exists in our CB1 area.
Describe what kind of data would have helped you contextualize this issue.
Accurate data tracked by the City and State on stabilization, affordability, owner benefits and programs.
What challenges prevented you from using data resources to contextualize this issue?
- The data hadn’t been published in an accessible format.
- The data was not up-to-date.
Elaborate on the challenges you selected above.
After gathering all state and city available data, our committee wound up having to go door to door with questions to try to straighten out incorrect data kept on web sites. It took months.
Do you have any specific recommendations for how this data should be structured, formatted, or displayed? If so, describe them below.
Yes — since stabilization and affordability information great benefits residents of our area, it should be clear and accessible.
Other Responses
Committee Name: Parks and Recreation
Describe the issue that came before your committee, district office, or council office.
When NYC Ferry was presenting their proposed new ferry landing at Corlears Hook they were routinely asked by members of the committee to provide ridership numbers of other docking stations and they could not do it. It would have helped us make a better informed decision and also addressed fears of community members about the potential influx of people coming off the boats.
Free Data Software Applications
Google Data Studio
Google Data Studio is an online tool that enables users to build custom reports and dashboards from datasets. Users can access data that they have stored in Google Sheets, as well as connect directly with data stored in Socrata to create tables, charts, and graphics that filter with user input.
Link: https://datastudio.google.com/
Online guides and tutorials:
https://www.distilled.net/resources/google-data-studio-the-beginners-tutorial/
https://datadrivenlabs.io/blog/how-to-build-a-data-studio-dashboard/
https://www.youtube.com/watch?v=6FTUpceqWnc&list=PLI5YfMzCfRtag7tBfbVvA4_a6YZxWHEO4
Google Sheets
Google Sheets is an online spreadsheet application that enables users to store, sort, filter, and compute with datasets.
Link: https://docs.google.com/spreadsheets/u/0/?tgif=d
Online guides and tutorials:
https://gsuite.google.com/learning-center/products/sheets/get-started/#!/
QGIS
QGIS is a free and open source geographic information system (GIS) application. It can be used to map census data, along with any other dataset on the City’s or the State’s Open Data Portal that includes geographic fields.
Link: https://qgis.org/en/site/
Online guides and tutorials:
https://www.qgistutorials.com/en/
https://www.youtube.com/watch?v=WAbOR_E2xtI
https://docs.qgis.org/2.18/en/docs/user_manual/
RStudio (advanced)
R Studio is a free and open source software application for programming with the statistical language R. R is a powerful tool for analyzing datasets and creating data graphics.
Link: https://www.rstudio.com/
Online guides and tutorials:
https://www.datacamp.com/courses/free-introduction-to-r
http://web.cs.ucla.edu/~gulzar/rstudio/basic-tutorial.html
https://www.amazon.com/Learn-R-Day-Steven-Murray-ebook/dp/B00GC2LKOK
https://www.rstudio.com/resources/cheatsheets/
Tableau Public
Tableau Public is a free software application that users can leverage to build web-based visualizations and dashboards from datasets.
Link: https://public.tableau.com/en-us/s/
Online guides and tutorials:
https://public.tableau.com/en-us/s/resources
[1] Rogers, D. (1990). Community Control and Decentralization. In J. Bellush & D. Netzer (Eds.), Urban Politics, New York Style (pp. 143–187). M.E. Sharpe.
[2] Community boards prepare district needs statements once a year, outlining the primary issues facing their districts and prioritizing budgetary items to address those issues.
[3] Lehrer, B. (2018, August 27). Borough Presidents on Community Board Reform. Retrieved from https://www.wnyc.org/story/bps-community-board-reform/
[4] Katz, M. (2016, April 12). Why Do NYC Community Boards Have So Little Power? Gothamist. Retrieved from http://gothamist.com/2016/04/12/nyc_community_board_explainer.php
[5] See: https://www.beta.nyc/
[6] See: http://nycroadmap.us/
[7] For more information about BoardStat, please see: https://www.beta.nyc/products/boardstat/
[8] See: Crawford, Barocas, Solon, and Andrew D Selbst. 2016. “Big Data’s Disparate Impact.” California Law Review 104: 671; Kate. 2013. “The Hidden Biases in Big Data.” Harvard Business Review (blog). April 1, 2013. http://blogs.hbr.org/2013/04/the-hidden-biases-in-big-data/.
[9] See: Fortun, Kim, Lindsay Poirier, Alli Morgan, Brandon Costelloe-Kuehn, and Mike Fortun. 2016. “Pushback: Critical Data Designers and Pollution Politics.” Big Data & Society 3 (2): 2053951716668903. https://doi.org/10.1177/2053951716668903.
[10] Emerging research in critical data studies has begun to unpack the ways in which data has been wielded as a form of power. See: boyd, danah, and Kate Crawford. 2012. “Critical Questions for Big Data.” Information, Communication & Society 15 (5): 662–79. https://doi.org/10.1080/1369118X.2012.678878; Kitchin, Rob, and Tracey P. Lauriault. 2014. “Towards Critical Data Studies: Charting and Unpacking Data Assemblages and Their Work.” SSRN Scholarly Paper ID 2474112. Rochester, NY: Social Science Research Network. https://papers.ssrn.com/abstract=2474112; Iliadis, Andrew, and Federica Russo. 2016. “Critical Data Studies: An Introduction.” Big Data & Society 3 (2): 2053951716674238. https://doi.org/10.1177/2053951716674238.
[11] Andrejevic, Mark. 2014. “The Big Data Divide.” International Journal of Communication 8 (0): 17.
[12] Cohn, D’Vera. 2018. “What to Know about the Citizenship Question the Census Bureau Is Planning to Ask in 2020.” Pew Research Center (blog). March 30, 2018. http://www.pewresearch.org/fact-tank/2018/03/30/what-to-know-about-the-citizenship-question-the-census-bureau-is-planning-to-ask-in-2020/.
[13] Eubanks, Virginia. 2018. Automating Inequality: How High-Tech Tools Profile, Police, and Punish the Poor. St. Martin’s Press.
[14] Crawford, Kate, and Jason Schultz. 2013. “Big Data and Due Process: Toward a Framework to Redress Predictive Privacy Harms.” SSRN Scholarly Paper ID 2325784. Rochester, NY: Social Science Research Network. http://papers.ssrn.com/abstract=2325784.
[15] These commitments put us in conversation with several other organizations devoted to advancing data justice such as the Detroit Digital Justice Coalition (http://detroitdjc.org/), The New School’s Digital Equity Lab (https://www.newschool.edu/digital-equity-lab/), and the Data Justice Lab (https://datajusticelab.org/).
[16] Community board chairs meet with city agency liaisons monthly at Borough Board meetings. Similarly, district managers meet with city agency liaisons monthly at Borough Service Cabinet meetings. At times, boards will use these meetings as an opportunity to address data quality issues with the city agencies producing the data.
[17] Research in critical data studies has shown that, when community members have input into data interpretation, they can build counter-narratives that highlight the needs of underserved communities. For instance, in Los Angeles, activists have leveraged police officer-involved homicide data, in conjunction with more qualitative and visual forms of data, to build alternative narratives around racial profiling in policing. See: Currie, Morgan, Britt S Paris, Irene Pasquetto, and Jennifer Pierre. 2016. “The Conundrum of Police Officer-Involved Homicides: Counter-Data in Los Angeles County.” Big Data & Society 3 (2): 2053951716663566. https://doi.org/10.1177/2053951716663566.
[18] The NYC Open Data Law was signed into law on March 7, 2012, amending the City administrative code to recommend that city agencies publish their datasets to a public Web portal in accordance with technical standards. To review the NYC Open Data Law in full, see: https://www1.nyc.gov/site/doitt/initiatives/open-data-law.page
[19] New York State Governor Andrew Cuomo signed Executive Order Number 95: Using Technology to Promote Transparency, Improve Government Performance and Enhance Citizen Engagement on March 11, 2013.
[20] See: https://communityprofiles.planning.nyc.gov/
[21] The NYU Furman Center conducts research and produces data about NYC housing, neighborhoods, and urban issues. It aggregates and standardizes several data sources to publish both property-level and neighborhood-level data around demographics, housing markets, renting, and neighborhood services. See: http://furmancenter.org/neighborhoods
[22] An illegal conversion occurs when a building owner modifies or alters a building to create additional units without first receiving approval from the Department of Buildings (DOB) to do so. In May 2017, New York City Council enacted a bill (Intro 1218: http://legistar.council.nyc.gov/LegislationDetail.aspx?ID=2764886&GUID=EF92B99F-832C-4095-B258-698F026A88CA&Options=ID|Text|&Search=1218) to impose financial penalties on building owners illegally converting residential spaces. They cited concerns that doing so created unsafe living conditions for residents. Others have voiced concerns that cracking down on illegal conversions hurts low-income communities renting the converted spaces at below-market-rate costs (see: Miller, Carly. 2017. “City Council Votes To Combat Illegal Home Conversions Plaguing Southern Brooklyn.” May 10, 2017. https://bklyner.com/city-council-votes-combat-illegal-home-conversions-plaguing-southern-brooklyn/). Several boards have cited concerns that building owners are illegally converting buildings in order to illegally rent them out as hotels through services like AirBNB, depleting affordable housing stock.
[23] A heat map displays the saturation of complaints in a given location by shading areas with many complaints darker than areas with fewer complaints, whereas a point map displays a single point for every complaint made at a location.
[24] The user journey model mapped here is adapted from a template provided by the NYC Service Design Studio. See: https://civicservicedesign.com/connect-the-dots-mapping-the-user-journey-8ec1c4d66bc0
[25] See: https://zola.planning.nyc.gov/
[26] ULURP is a process by which NYC land use and zoning changes are publicly reviewed. After an application for a zoning change (such as an upzoning) is certified by DCP, Community Boards have 60 days to hold a public hearing, review the proposal, and develop an advisory resolution to be sent to the City Planning Commission (CPC), the applicant, and the Borough President.
[27] Other U.S. cities, such as Baltimore, Seattle, San Francisco, and Hartford publish data about 911 calls. All of these datasets include a description of the incident, the date of the incident, and the incident address. A lack of city data about policing in NYC has also been a concern for underserved, targeted communities, who need better access to information about police interactions with the public in order to legitimize and advocate for police reform. In other cities and states, this data is being used to make policing more transparent. For instance, the Citizen’s Open Data Project (https://invisible.institute/police-data/) publishes data to report police use of force and misconduct to the public. Similarly, Open Data Policing (https://opendatapolicing.com/) aggregates and visualizes data about police traffic stops in North Carolina, Maryland, and Illinois.
[28] Residents living in rent-stabilized apartments are protected against sharp rent increases and have a right to renew their leases. Rent-stabilization laws were enacted in 1969, and have been amended frequently since. Today, about 1 million NYC apartments are rent-stabilized.
[29] See: https://webapps.nyc.gov/CICS/fin1/find001I
[30] The Borough Block Lot (BBL) is a unique number DCP assigns to all city lots. This number is often included in city datasets about city properties to identify the precise lot being referenced in a row in the dataset. DCP has created files called the Primary Land Use Tax Lot Output (PLUTO) that can be loaded into mapping software (such as ArcGIS or QGIS) to create a map displaying a polygon representing every lot in the City. When other datasets include the BBL in each row, it is possible to merge the dataset with PLUTO to create maps of the dataset.
[31] In May 2018, the Manhattan Borough President, Gale A. Brewer, sent a letter to the Commissioner of the DOT, requesting that this data be updated. BetaNYC also sent submitted a request to the City’s Open Data Team to see this data updated. Through this engagement, the DOT updated the data on their website and is working to get the data onto the City’s Open Data Portal by the end of 2019.
[32] BetaNYC produced a map to visualize these geographies and check which administrative boundaries overlap with community boards. The Boundaries Map can be viewed at: https://betanyc.github.io/Boundaries-Map/
[33] DCP has published Geosupport software that any user can download to process geographic information about the City. When a user enters an address, street, or building into the software, it returns location and neighborhood information about the property (such as its BBL, the various districts to which it belongs, its owner, and its geographic coordinates). A version of the software enables users to upload a dataset with many addresses; the system will append geographic information to the dataset.
[34] Customizing neighborhood boundaries poses a trade-off. While it is important to use and reference standard geographic boundaries across the City — so that data produced in different contexts, by different departments, at different times can be aggregated into unified views — oftentimes, the geographic standards put out by City departments do not align with how community boards understand their own communities. In certain contexts, DCP has shared with us their concerns about groups making up their own city neighborhoods and formalizing them into geographic datasets. We understand these concerns. We certainly do not want commercial interests dividing neighborhoods to advance their own profit. At the same token, we understand that the way that data gets sliced and diced can exaggerate certain trends and eclipse others. Living and/or working within the communities the data represents, community board members and district office staff are perhaps the best figures to identify the geographic boundaries that make most sense in their neighborhoods. Enduring this tension will require figuring out ways to design flexibility into geographic standards without allowing them to proliferate.
[35] BetaNYC recently published a report on community board technical infrastructure needs; “BetaNYC and Civic Innovations Fellows Community Board and Technology Needs Report”
[36] The NYC Open Data Team, in collaboration with city librarians, has also worked to make city datasets more accessible to users by hosting “Metadata for All” events, in which stakeholders discuss ways to the make the documentation of the City’s most used datasets more user-friendly. The open data consulting organization, Datapolitan also has published slides and materials on using the City’s open data resources on the City’s Open Data Portal.
[37] See the BetaNYC curriculum published on the City’s Open Data Portal at: https://opendata.cityofnewyork.us/how-to/
[38] A data dictionary is a document that outlines definitions for each of the dataset’s fields, describes the relationships between fields, and documents the format of each entry.
[39] NYC’s Open Data for All 2017 Progress Report listed 316 eligible datasets that were not in compliance with Local Law 108 of 2015. The report noted how DoITT was working aggressively to get all datasets in compliance by November 30, 2017 — one year after the Law’s effective date. See: https://moda-nyc.github.io/2017-Open-Data-Report/report/compliance-plan/
As of August 2018, 88 eligible datasets remain on that list. See: https://data.cityofnewyork.us/City-Government/2017-NYC-Open-Data-Plan-Address-Standardization/xcah-6evp/data
BetaNYC has been working with the City’s Open Data Team to prioritize the datasets most needing standard geospatial fields. However, due to the size of some of the datasets and the resources available to the Team, this process can take several months for even one dataset.
[40] The Community Planning Fellowship program (managed by the Fund for the City of New York) partners Master’s students in NYC urban planning programs with community boards looking to carry out a planning project. For a full academic year, Community Planning Fellows work with the community board about 15 hours per week to address local quality of life issues. Students receive a stipend each semester for their work, and at the end of the fellowship, they submit a final report to the community board. For more information see: https://www.fcny.org/fcny/core/cpf/ BetaNYC hosted a joint event, introducing boards to the City’s Community Planning Fellowship program and the BetaNYC Civic Innovation Lab on June 29, 2018. The event is archived at https://www.youtube.com/watch?v=SMblLYqmh2g.
[41] In 2008, the NYC MTA began a subway advertising campaign encouraging New Yorkers to call 311 for homeless assistance. The New York Times published about spikes in 311 homeless complaints in 2015. See: Fessenden, Ford. 2015. “A Homeless Epidemic in New York? Thousands Hit the Cold Streets to Find Out.” The New York Times, October 26, 2015, sec. New York. https://www.nytimes.com/interactive/2015/10/21/nyregion/new-york-homeless-people.html,
[42] Crawford, Kate. 2013. “The Hidden Biases in Big Data.” Harvard Business Review (blog). April 1, 2013. http://blogs.hbr.org/2013/04/the-hidden-biases-in-big-data/.
[43] In 2017, New York City Council published a report that presented research on the City’s vacant storefront problem and outlined a series of recommendations for addressing the issue. See: New York City Council. 2017. “Planning for Retail Diversity: Supporting NYC’s Neighborhood Businesses.” https://council.nyc.gov/land-use/wp-content/uploads/sites/53/2017/12/NYC-Council-Planning-For-Retail-Diversity.pdf
[44] Other data collection on vacant storefronts has been carried out on an ad-hoc basis and has been limited in scope. For instance, in April 2017, New York State Senator Brad Hoylman (2017) and his team walked along Bleeker St. counting the number of visibly vacant retail spaces, office spaces, and restaurants, finding 18.44% to be vacant (See: Garofalo, Michael. 2017. “Rx for Vacant Storefront Epidemic.” December 20, 2017. http://www.ourtownny.com/local-news/20171220/rx-for-vacant-storefront-epidemic.). In May 2017, Manhattan Borough President Gale Brewer and a group of volunteers went door to door canvassing all of Broadway Ave, noting 188 vacant storefronts (See: King, Kate. 2017. “Manhattan Tallies Vacant Storefronts.” Wall Street Journal, May 21, 2017, sec. US. https://www.wsj.com/articles/manhattan-tallies-vacant-storefronts-1495393079). In the summer 2017, the office of City Council Member Helen Rosenthal surveyed the Upper West Side regarding the number of vacant storefronts; the team canvassed Broadway Ave., Amsterdam Ave., Columbus Ave., and several cross-streets, concluding that 12% of storefronts were vacant.
[45] We recognize that there is also potential for major gaps and biases with landlord-reported data. A start-up tenant watchdog organization, the Housing Rights Initiative, recently revealed that many landlords have misreported the number of rent-regulated units in their buildings to circumvent tenant protections (See: Bagli, C. V. (2018, September 24). Are Landlords Telling the Truth? The City Doesn’t Always Check. He Does. The New York Times. Retrieved from https://www.nytimes.com/2018/09/23/nyregion/housing-rights-initiative-aaron-carr-nyc-kushner.html). We believe that this registry should be considered a near-term solution, while alternatives for tracking vacant storefronts are considered.
[46] Not every business in the City is required to get a license through DCA. A list of industries requiring a DCA permit (and thus represented in this dataset) can be found at: https://www1.nyc.gov/site/dca/businesses/licenses-apply.page. A few particularly relevant industries include electronics stores, retail laundry, and tobacco retail dealers.
[47] See: https://aca.licensecenter.ny.gov/aca/GeneralProperty/PropertyLookUp.aspx?isLicensee=Y
[48] Scraping the data about barbershops and beauty salons proved to be a time-consuming task, requiring access to several thousand license pages. To hear more about our work with this and to access the code to the Python scraper, see: Poirier, Lindsay. 2018. “Scraping Data about Manhattan’s Licensed Beauty Salons and Barbershops.” BetaNYC (blog). May 15, 2018. https://www.beta.nyc/2018/05/15/scraping-nys-beauty-salon-and-barbershop-data/. BetaNYC supported Manhattan Borough President Gale A. Brewer in sending a letter to the New York Secretary of State, requesting that this data be made available on the State’s Open Data Portal.
[49] BetaNYC has also considered interfacing with Yelp to track operating businesses throughout the City. However, we are hesitant to follow this approach because we have found that Yelp data tends to be more up-to-date in communities that are denser and more digitally connected.
[50] There are two distance laws that apply to New York State liquor license applicants — the 500 foot rule and the 200 foot rule. The 500 foot rule restricts the number of on-premise liquor licenses that can be awarded within 500 feet of each other in New York State cities and towns with a population of 20,000 or more. In cases where there are already 3 or more establishments within 500 feet of the proposed establishment, the license will only be awarded if the SLA finds that it is in the public interest to do so. Renewals cannot be denied based on the 500 foot rule. The 200 foot rule prohibits the issuance of liquor licenses to establishments that are within 200 feet of a school or a place of worship.
[51] A Certificate of Occupancy is a document certified by the DOB that states the legal use of a building.
[52] See: http://lamp.sla.ny.gov/
[53] See: https://www.beta.nyc/maps/slam/
[54] Issues and feedback can be reported at: https://github.com/BetaNYC/SLAM/issues
[55] See: Vincent, Isabel, and Melissa Klein. 2016. “Buildings Dept. Approves Night Construction, Angering Residents.” New York Post (blog). January 31, 2016. https://nypost.com/2016/01/31/buildings-dept-approves-night-construction-angering-residents/; Brenzel, Kathryn, and Miriam Hall. 2016. “Wait until Dark: DOB Issues Tons of after-Hour Permits, but Almost Never Revokes Them.” The Real Deal New York. September 19, 2016. https://therealdeal.com/2016/09/19/wait-until-dark-dob-issues-tons-of-after-hour-permits-but-almost-never-revokes-them/; Glassman, Carl. 2016. “‘Can You Do Something About It?’ Residents Ask at Construction Forum | Tribeca Trib Online.” Tribeca Tribune, October 12, 2016. http://www.tribecatrib.com/content/can-you-do-something-about-it-residents-ask-construction-forum; Conley, Kirstan. 2017. “Noise Complaints about City Construction More than Doubled.” New York Post (blog). September 1, 2017. https://nypost.com/2017/08/31/noise-complaints-about-city-construction-more-than-doubled/.
[56] See: http://a810-bisweb.nyc.gov/bisweb/bsqpm01.jsp
[57] The DOB’s Building Footprints dataset is a file that can be loaded into mapping software (such as ArcGIS or QGIS) to create a map displaying a polygon representing the footprint of every constructed building in the City.
[58] These dashboards can be viewed at: https://www.beta.nyc/products/ahv-dashboard/
[59] See: https://www1.nyc.gov/site/rentguidelinesboard/resources/rent-stabilized-building-lists.page
[60] 421a is a tax exemption offered to owners of a multi-family residential property whose property value changed after they did construction on the property. The benefits of 421a are awarded based on the property’s location, use, and affordable housing options.
[61] See: https://a836-acris.nyc.gov/CP/
[62] See: Krauss, John. 2015. “Whither Rent Regulation — Accursed Ware.” July 1, 2015. http://blog.johnkrauss.com/where-is-decontrol/.
[63] For example, when the U.S. Emergency Planning and Community Right to Know Act mandated industrial facilities to publicly disclose their annual toxic emission releases, it profoundly transformed the way that environmental toxins get regulated in the U.S. — not only encouraging facilities to cut back on emissions, but also fostering new forms of public activism around environmental injustices, instigating facilities to develop new ways to manipulate the data to hide poor practices, and provoking political controversy around appropriate forms of oversight. See: Konar, Shameek, and Mark A. Cohen. 1997. “Information As Regulation: The Effect of Community Right to Know Laws on Toxic Emissions.” Journal of Environmental Economics and Management 32 (1): 109–24. https://doi.org/10.1006/jeem.1996.0955; Fung, Archon, and Dara O’rourke. 2000. “Reinventing Environmental Regulation from the Grassroots Up: Explaining and Expanding the Success of the Toxics Release Inventory.” Environmental Management 25 (2): 115–27. https://doi.org/10.1007/s002679910009.
[64] See: https://github.com/BetaNYC/Tenants-Maps
[65] See: http://maps.nyc.gov/streetclosure/
[66] See: http://maps.nyc.gov/doitt/nycitymap/template?applicationName=DOH_RIP
[67] See: http://legistar.council.nyc.gov/LegislationDetail.aspx?ID=3137815&GUID=437A6A6D-62E1-47E2-9C42-461253F9C6D0
[68] See: Hidalgo, Noel. 2017. “Testimony for Intro 1696-2017 (Open Algorithms Bill).” BetaNYC (blog). October 16, 2017. https://www.beta.nyc/2017/10/16/testimony-for-intro-1696-2017-open-algorithms-bill/.
[69] See: Hidalgo, Noel. 2018. “Dear de Blasio, Re: NYC Automated Decision Systems Task Force — #NYCAlgorithms.” BetaNYC (blog). January 23, 2018. https://www.beta.nyc/2018/01/23/dear-de-blasio-re-nyc-automated-decision-systems-task-force-nycalgorithms/.
[70] See: https://opendata.cityofnewyork.us/projects/
[71] In particular see the NYC Map Gallery (https://www1.nyc.gov/nyc-resources/nyc-maps.page) and the NYC Planning Labs project page (https://planninglabs.nyc/projects/).
[72] Users can submit data requests to the City’s Open Data Team at: https://opendata.cityofnewyork.us/engage/
[73] Users can submit feedback to the State at: https://data.ny.gov/dataset/Give-Feedback/fq3e-q75i
[74] All recent community board district needs statements can be found at: https://communityprofiles.planning.nyc.gov/
[75] See: https://opendata.cityofnewyork.us/open-data-law/
[76] Users can submit data requests at: https://opendata.cityofnewyork.us/engage/
[77] Users can sign up for the mailing list or for an account at: https://opendata.cityofnewyork.us/engage/
[78] See: https://shareabouts-pbnyc-2018.herokuapp.com/page/about
[79] See: https://www1.nyc.gov/site/charter/index.page
[80] The proposals are described at: https://www1.nyc.gov/site/charter/news/charter-commission-approves-proposals-relating-to-campaign-finance-community-boards-civic-engagement.page
[81] Written testimony can be submitted online at: http://www.charter2019.nyc/contact
[82] See: http://www.charter2019.nyc/hearings
[83] See: https://www.facebook.com/groups/betanyc/
[84] Individuals can sign up for the BetaNYC newsletter at: http://nyc.us6.list-manage2.com/subscribe?u=2b506b76155e3fbdd93699baf&id=32dc10066c
[85] See: https://civichall.org/eventscal/
[86] For more information about Open Data Coordinators, see: https://opendata.cityofnewyork.us/open-data-coordinators/
[87] See: https://treescountdatajam.devpost.com/
[88] See: Hidalgo, Noel. 2016. “TreesCount Data Jam 2016 Report Back.” BetaNYC (blog). August 5, 2016. https://www.beta.nyc/2016/08/05/treescount-data-jam-2016-report-back/.
[89] BetaNYC has provided testimony to the City’s Charter Revision Commission on the need for improving community board information and technical infrastructure. See: Hidalgo, Noel. 2018. “BetaNYC’s Testimony to NYC Charter Revision Commission Manhattan Meeting.” BetaNYC (blog). June 21, 2018. https://www.beta.nyc/2018/06/21/betanycs-testimony-to-nyc-charter-revision-commission-manhattan-meeting/.