Description
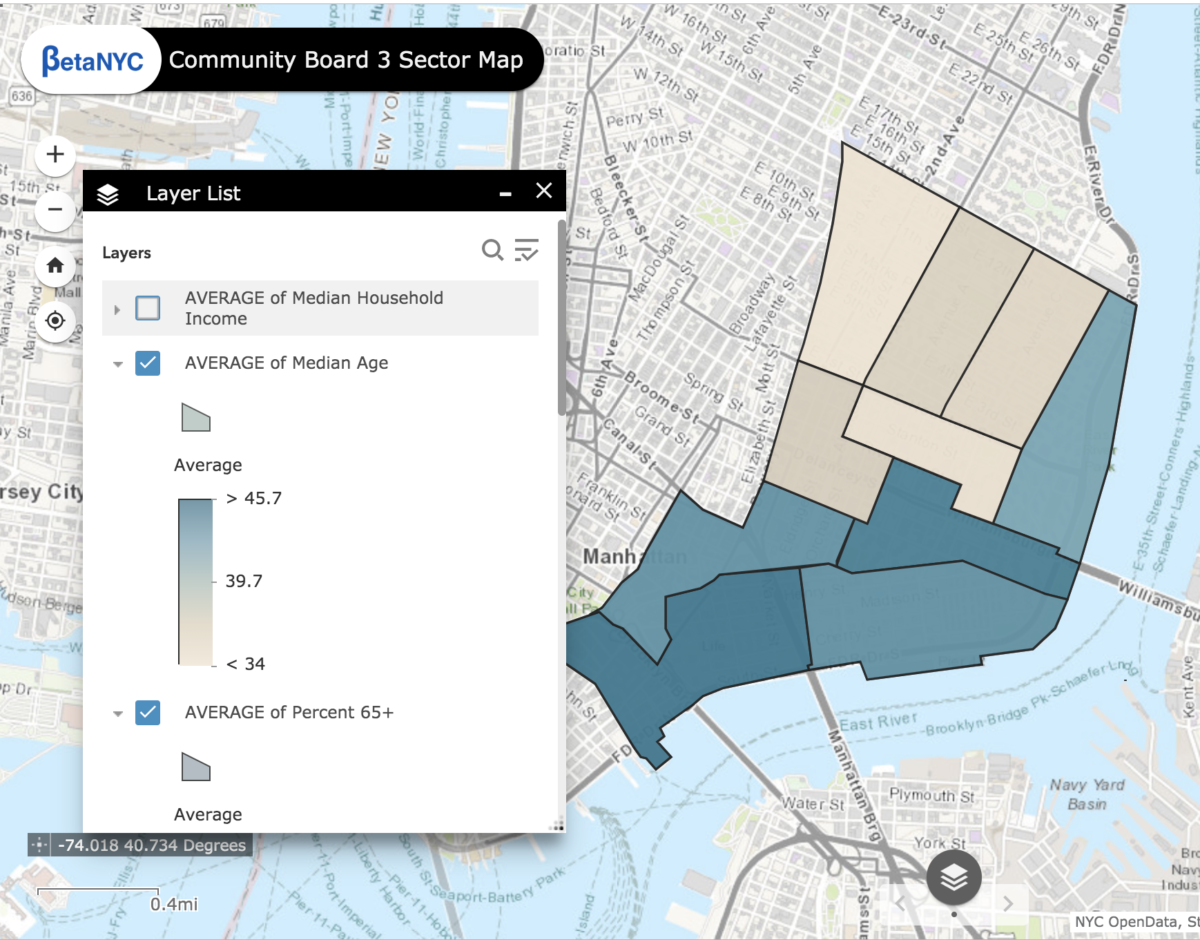
Created new shape files for each sector, and then merge them into a sector shape file. Aggregated demographic and socio-economic data at the tract level into sector and joined with sector shape file to create choropleth maps on most relevant / frequently asked about variables in Community Board 3 (including Median HH Income, Median Age, Percent 65+, Percent in Poverty, Percent with Disabilities).
Data sources:
– U.S. Census data
– Community District shape file
Uses: To visualize the district’s socio-demographic landscape and update and enhance existing information on their website.
Impact: For Community Board 3 to justify and strengthen their requests in the Statement of District Needs.
Level: 5 – Extensive coding required
Hours Worked: 36
Number of Personnel who contributed: 5
