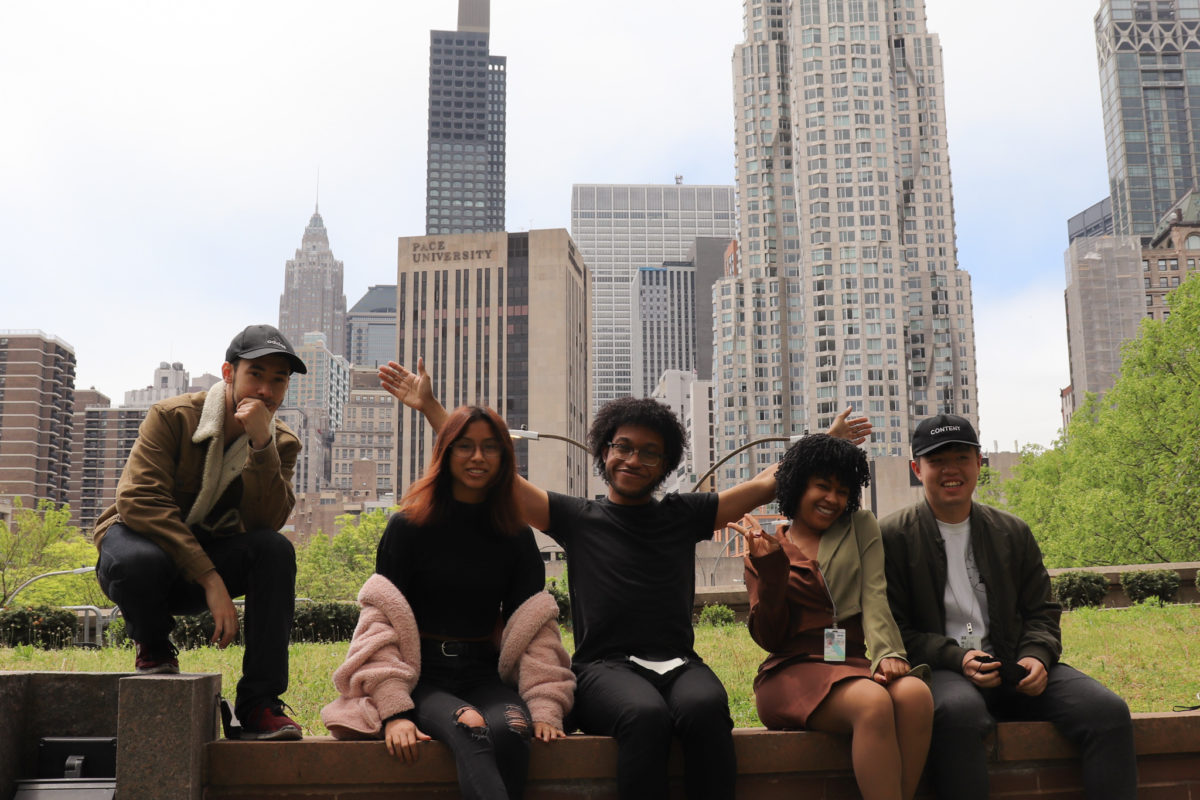
Each year, BetaNYC invites a cohort of CUNY Service Corps students to train and work with our team in our Civic Innovation Lab. This year students joined us during their second semester and worked with us 1-2 days a week from March through May. We are so pleased with this cohort’s energy and enthusiasm. They quickly learned how to use and analyze open data while also testing out a new “Mapping the Public Realm” curriculum. Students entered the lab with varying experience and familiarity with spreadsheets and basic data functions. Today we are thrilled to see them:
- create data visualizations using DataWrapper
- navigate NYC Open Data
- automate data processes using google sheets and the programming language R
- harness GIS tools to collect and map public realm data into OpenStreetMap
- build their own understanding of how our city operates and explore opportunities to use data, technology and design for civic good
In their final weeks with us, each student chose a topic and NYC Open Data to visualize and analyze. From housing evictions to street trees and tow trucks, check out summaries of their open data projects below. Congratulations Abdul, Dimitri, Kevin, Lizbeth, Nariah, Richard and Rosario! We’ll miss you!
Open Data Projects:
Evictions during COVID-19 by Abdul Wahab
Dataset(s): Database of NYC Housing Data (Office of Court Administration Data, PLUTO)
Art in Public Places by Rosario Diaz Salgado
Dataset(s): Public Design Commission Outdoor Public Art Inventory
Who let the dogs bite? An exploration of Dog Bites throughout the City. by Kevin Chen
Dataset(s): DOHMH Dog Bite Data
Comparing levels of traffic in NYC with levels of air pollution by Nariah Greene
Dataset(s): DOHMH Air Quality
Street Trees: How diverse is NYC’s urban forest? by Richard Batista
Dataset(s): Street Tree Census
Greenthumb Community Gardens: Where are they, and who do they serve? by Dimitri Mimy
Dataset(s): Greenthumb Community Gardens
Tow Trucks by Lizbeth Jima
Dataset(s): DARP-ROTOW Enrollment Status of Active Tow Truck Companies
Evictions during COVID-19
by Abdul Wahab
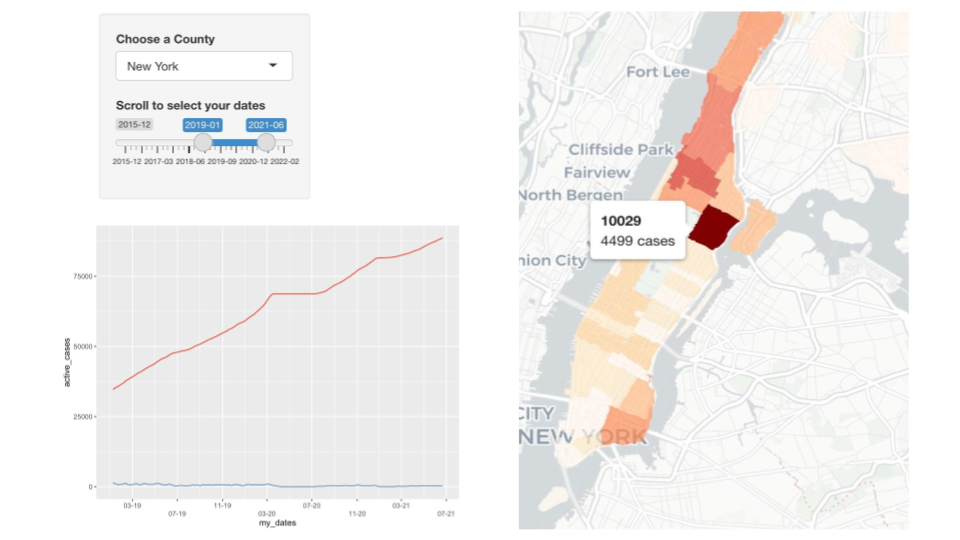
During the COVID-19 pandemic, 235,000 New York City tenants were on the brink of eviction. Abdul created a dashboard that illustrates the rise in eviction cases across New York City. Toggling between windows of time, users can view trends in eviction cases across a timeline and identify hotspots on a heatmap.
Dataset(s): Database of NYC Housing Data (Office of Court Administration Data, PLUTO)
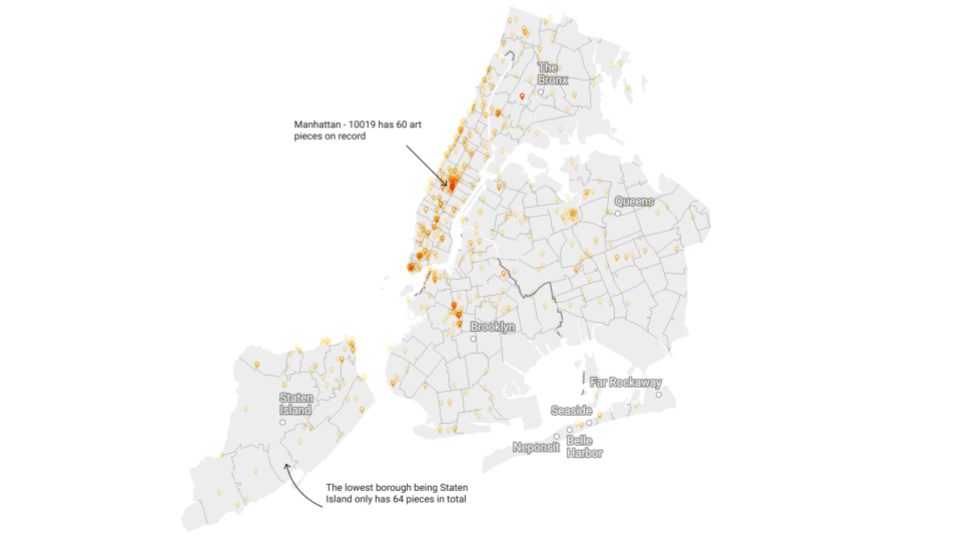
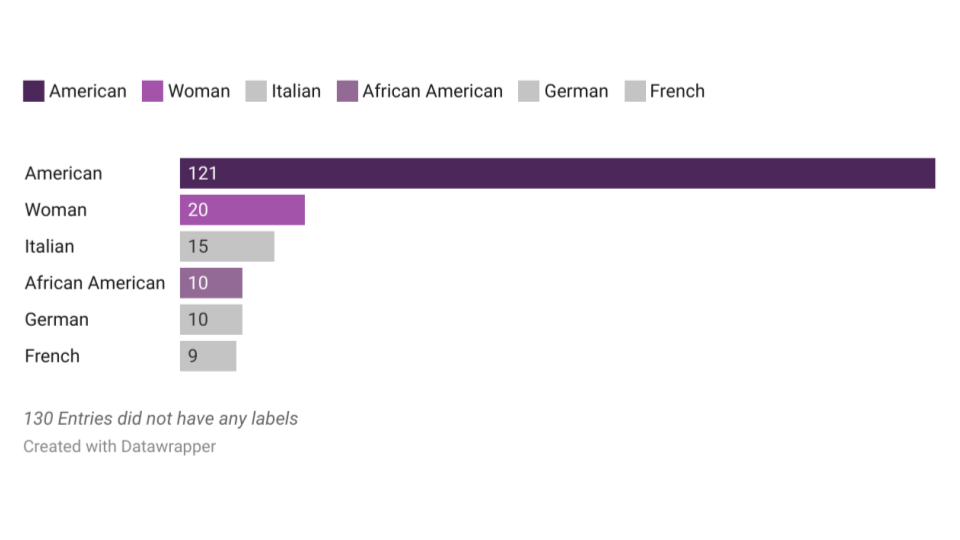
Art in Public Places
by Rosario Diaz Salgado
Fascinated by art in public places, Rosario analyzed data on City-owned public monuments, memorials, artworks and markers installed outside on City-owned property. Rosario created visualizations showing their distribution across the five boroughs and identified which boroughs have the most and fewest art pieces on record. Rosario also examined the cultural ideals promoted by the artworks, analyzing the genre labels associated with each artwork.
Dataset(s): Public Design Commission Outdoor Public Art Inventory
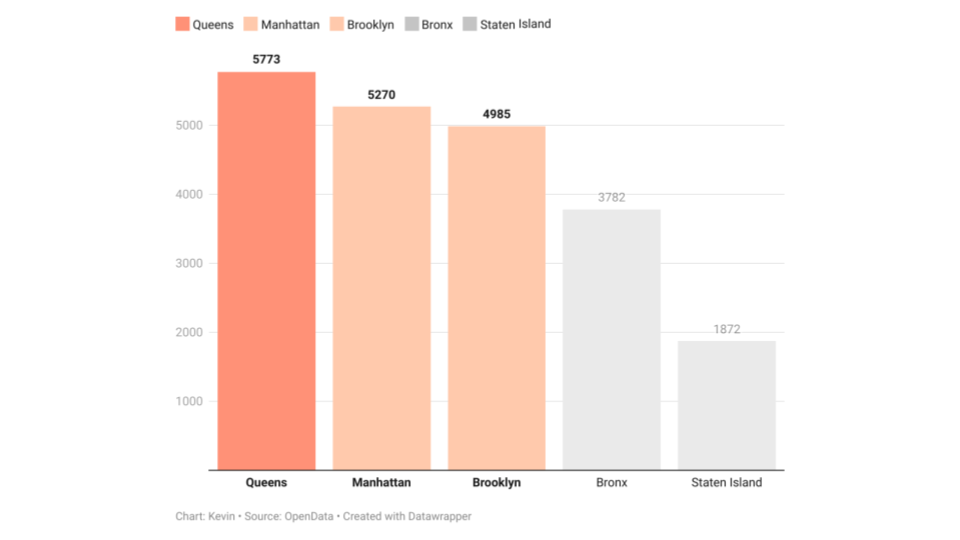
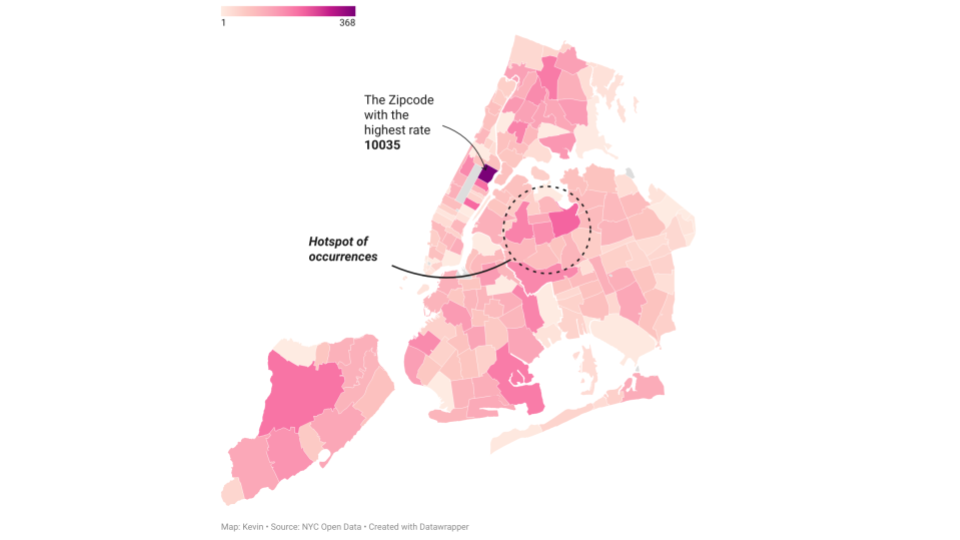
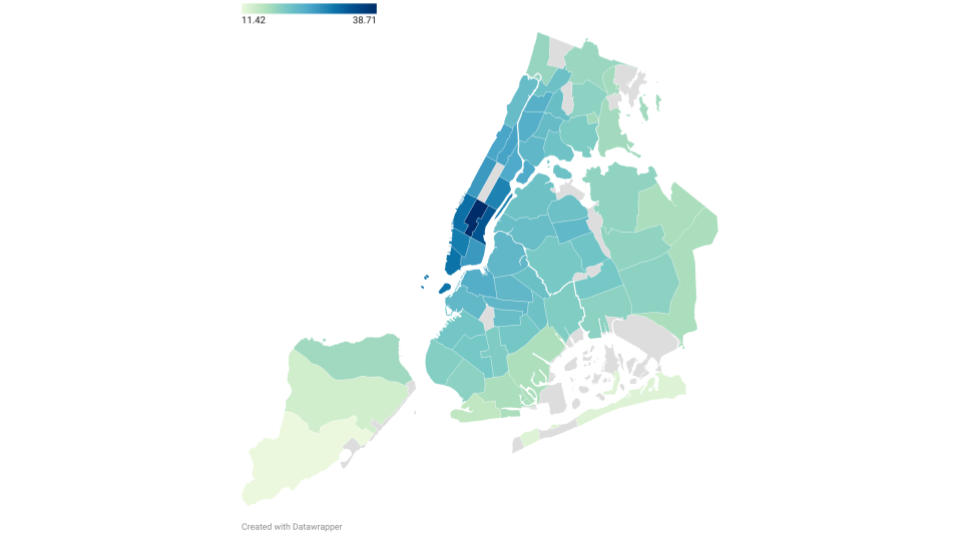
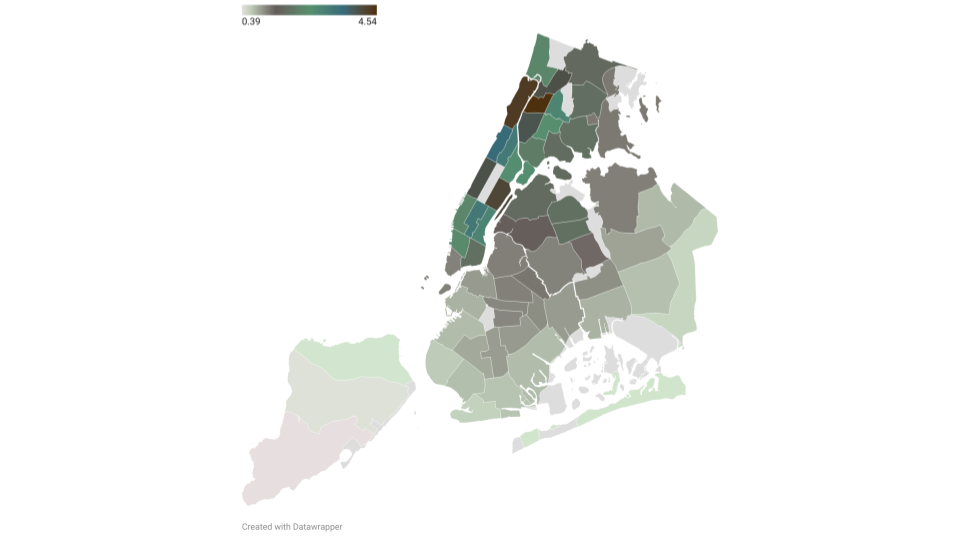
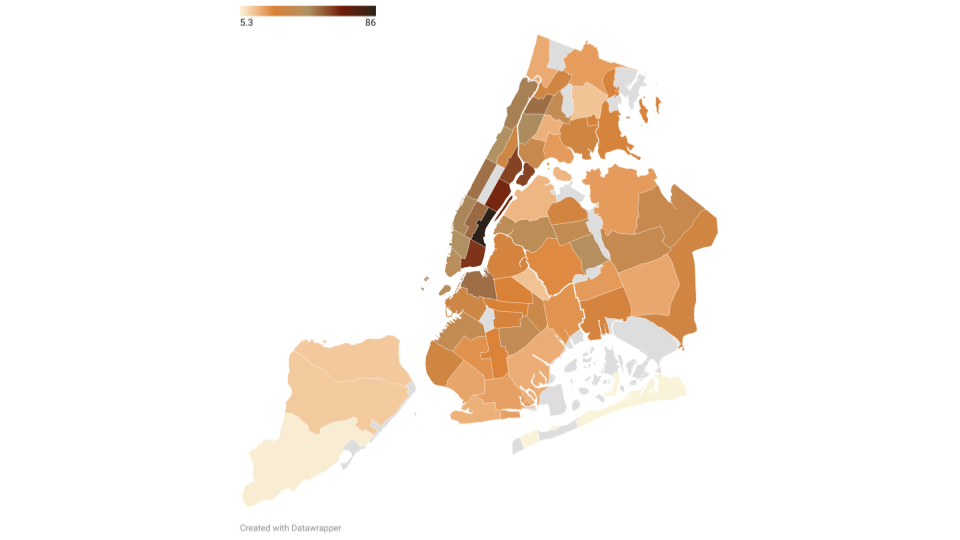
Who let the dogs bite? An exploration of Dog Bites throughout the City.
by Kevin Chen
Kevin had heard stories about dog bites and so when he came across an entire dataset about them, his curiosity piqued. Using a dataset from the Department of Health and Mental Hygiene, he visualized where dog bites occur most often throughout the five boroughs and whether a relationship exists between the number of incidents and a dog’s breed.
Dataset(s): DOHMH Dog Bite Data
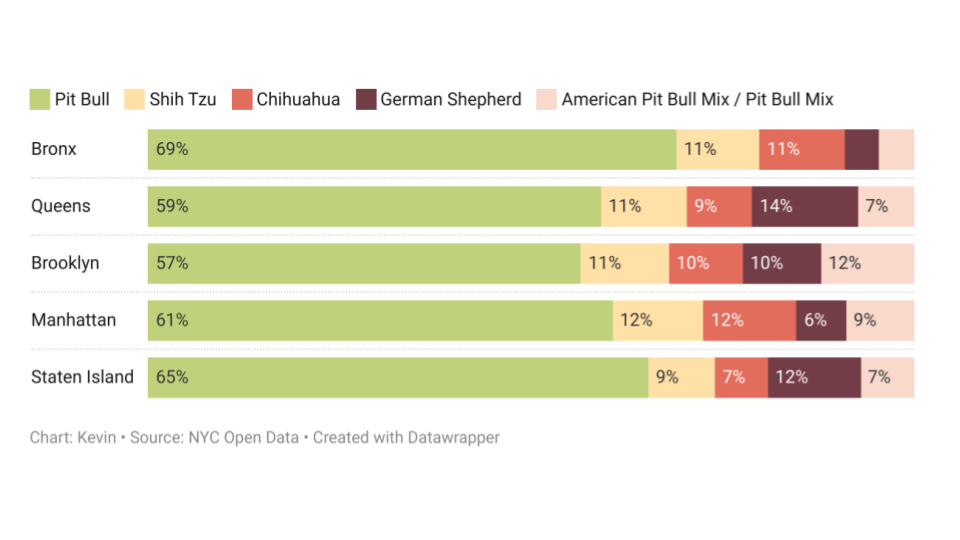
By top 5 Dog Breeds
Comparing levels of traffic in NYC with levels of air pollution
by Nariah Greene
Have you ever wondered what you’re breathing and where it’s coming from? Nariah visualized data on levels of Nitrogen Dioxide and Sulfur Dioxide in New York City. These air pollutants are both closely associated with vehicular traffic and so she also decided to create a map showing traffic density in NYC. With these maps, one can visually compare locations with high concentrations of both.
Dataset(s): DOHMH Air Quality
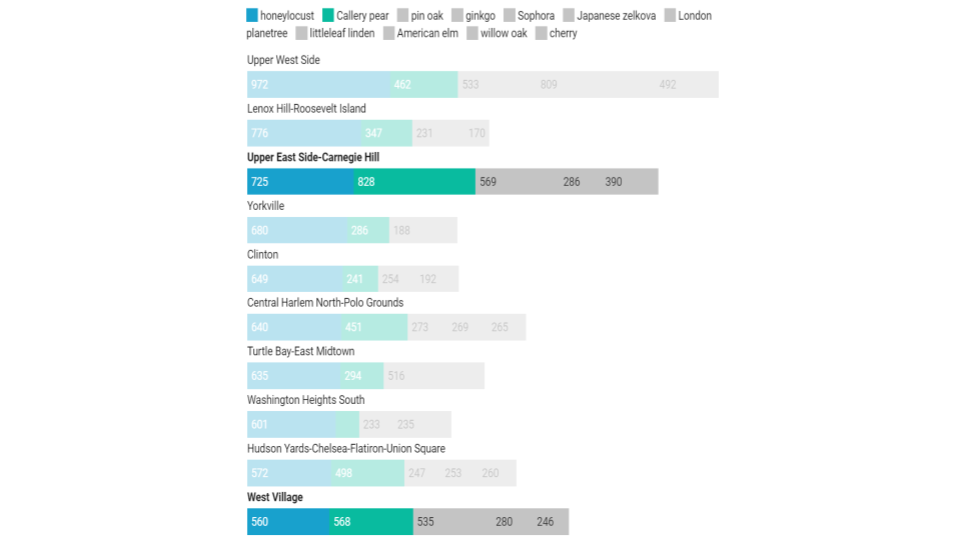
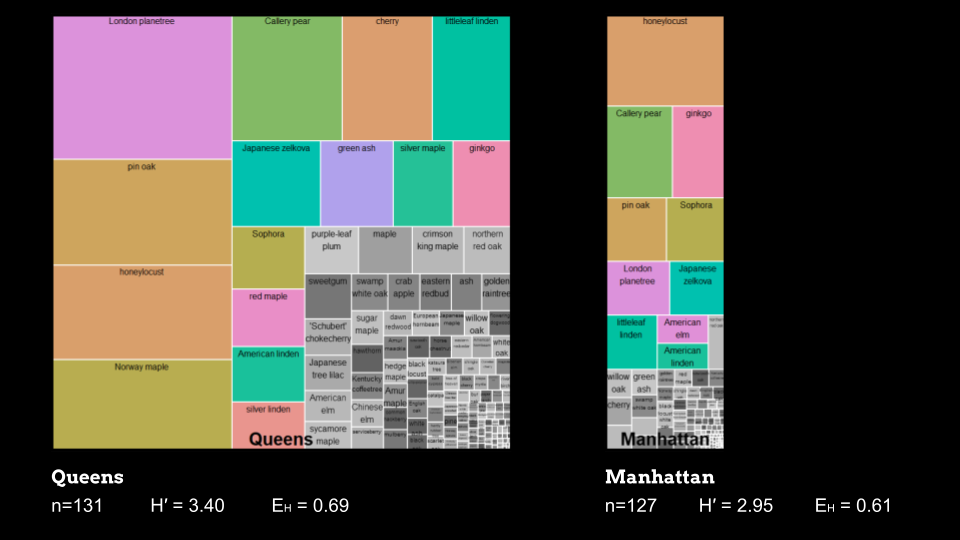
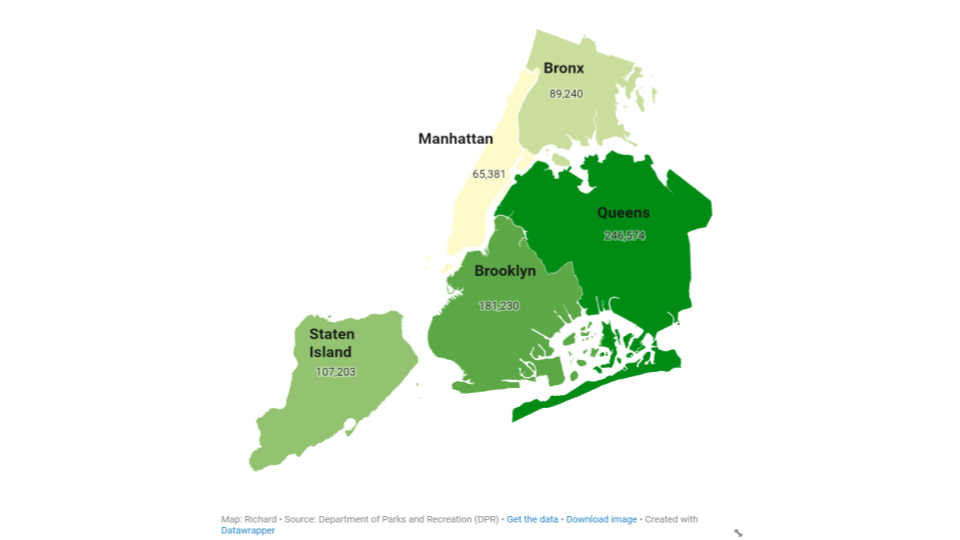
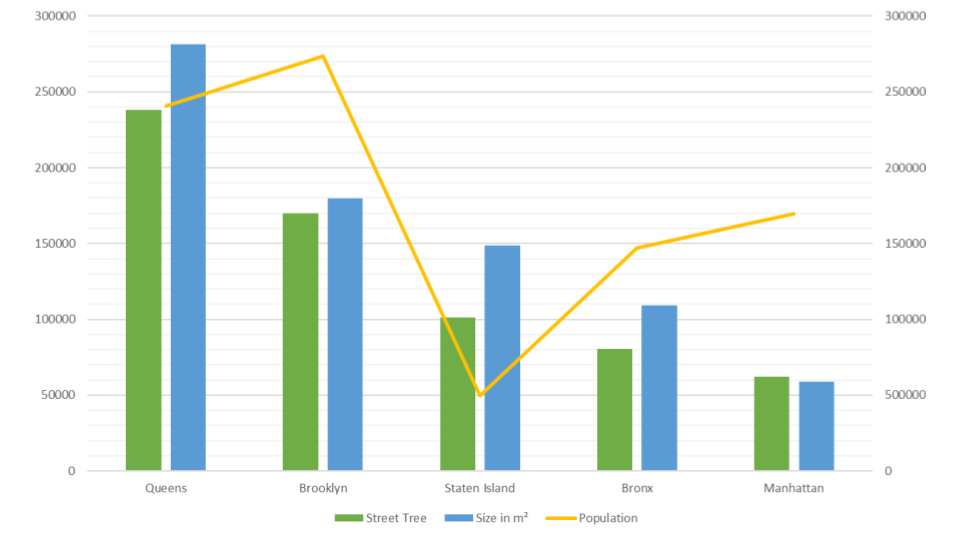
Street Trees: How diverse is NYC’s urban forest?
by Richard Batista
Did you know that over 680,000 Street Trees of 234 species have been mapped by NYC Parks? Interested in ecological biodiversity, Richard decided to take a closer look at this data. He created a visualization to compare the distribution of street trees across boroughs and neighborhoods, accounting for borough size and population. Next, he used species-level data to calculate the “evenness” of tree species across neighborhoods and boroughs, determining where most and least diversity exists and which species are most prevalent.
Dataset(s): Street Tree Census
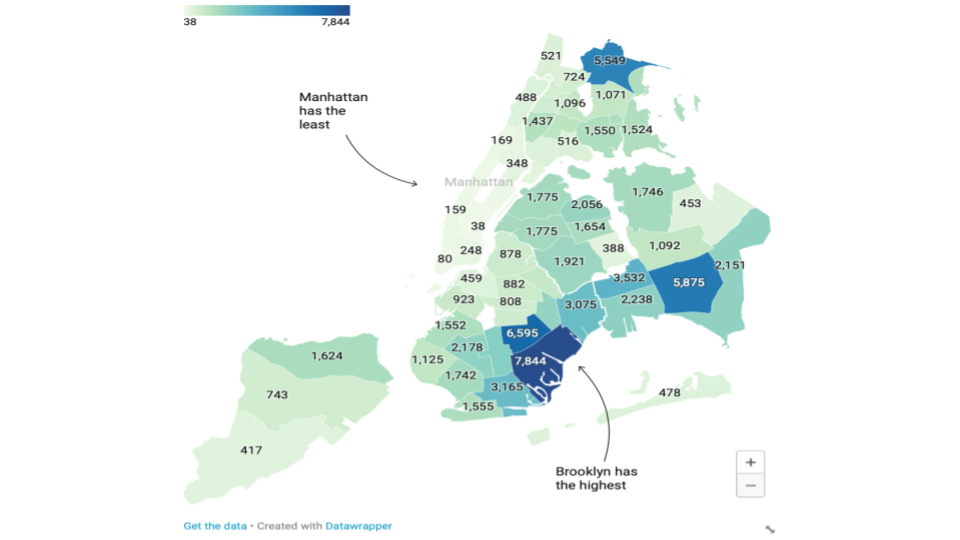
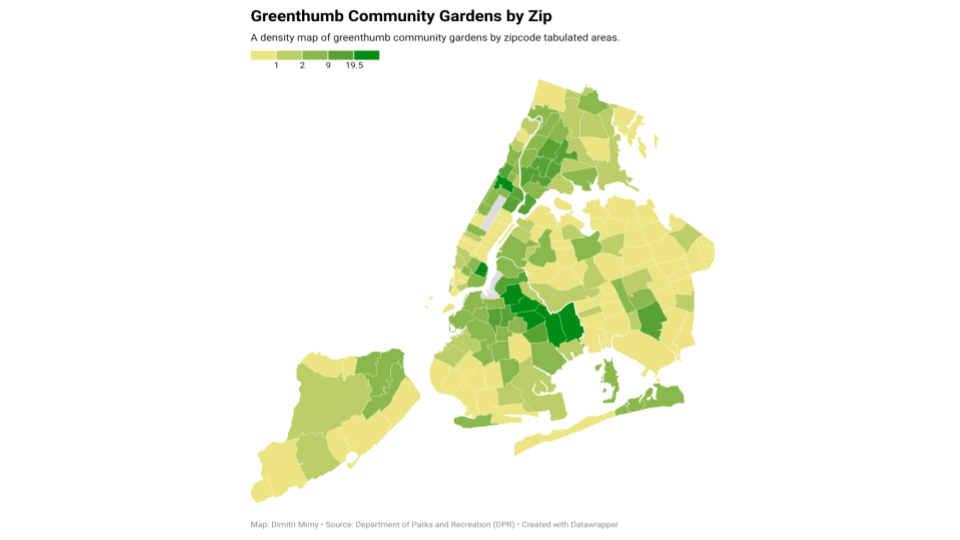
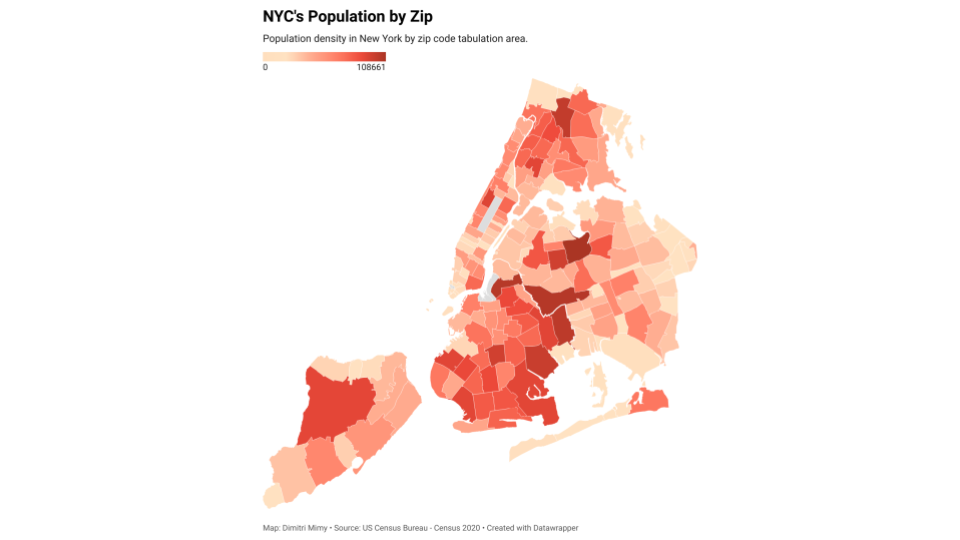
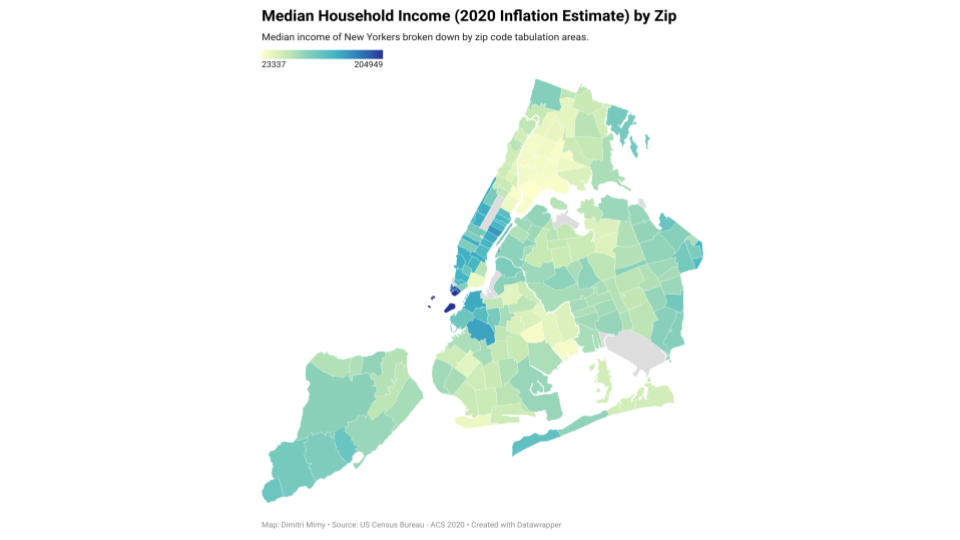
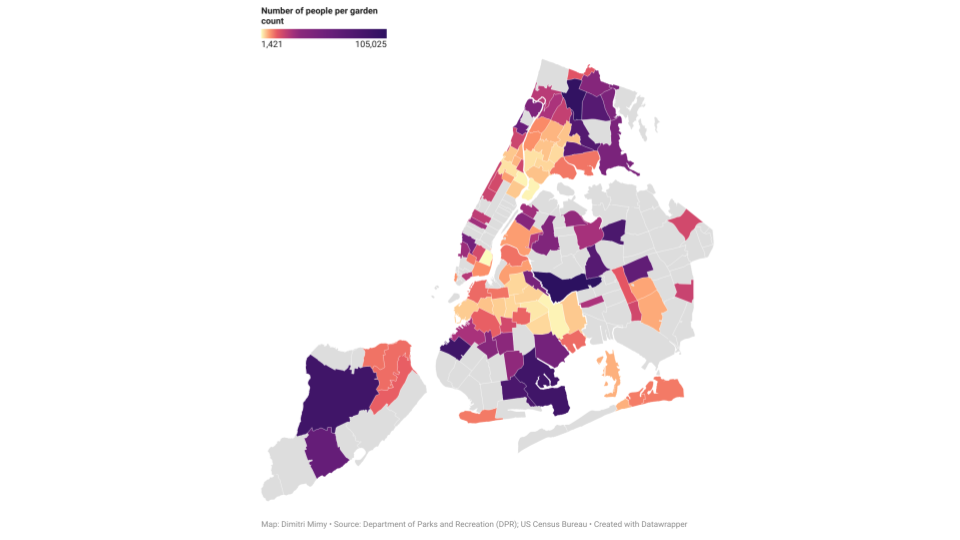
GreenThumb Community Gardens: Where are they, and who do they serve?
by Dimitri Mimy
Greenthumb is a nationwide community garden program supporting neighborhood access to green space. Interested in their mission to serve underserved areas in New York City, Dimitry mapped GreenThumb Community Gardens across New York City by zipcode to understand their distribution. Then, Dimitri drew up additional maps to depict the population density of the areas and income levels of the residents near them. Through comparison, he determined how levels of access to green space vary across the city, as well how well GreenThumb is achieving its mission to serve lower-income areas.
Dataset(s): Greenthumb Community Gardens
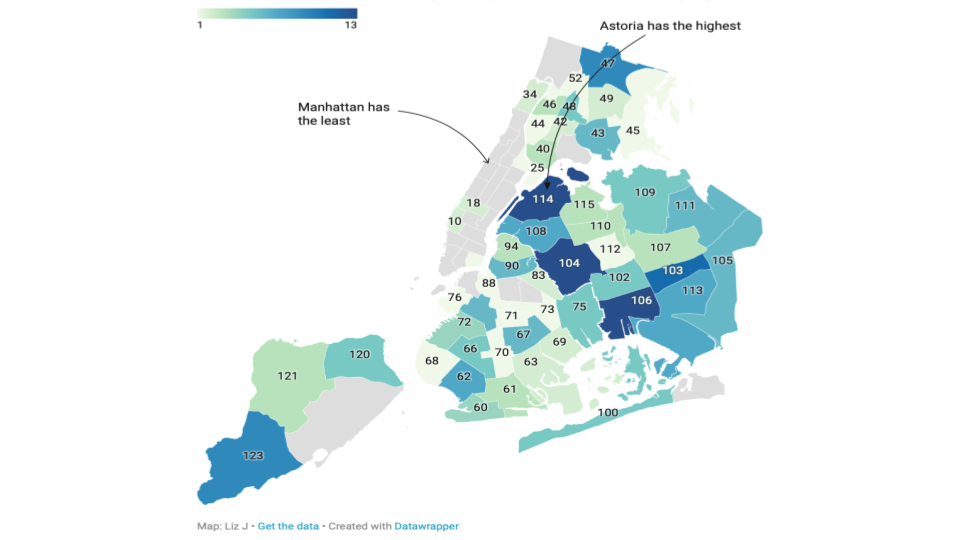
Tow Trucks
by Lizbeth Jima
Lizbeth investigated the operations of tow trucks in New York City. She created community district level maps that show where tow truck companies operate, and where they tow cars to and from. In her work, she used multiple datasets and learned about the different agencies responsible for identifying, reporting and towing vehicles.
Dataset(s): DARP-ROTOW Enrollment Status of Active Tow Truck CompaniesGardens