20 Research and Data Assistance Requests and their outputs
Introduction
What is RADAR ? :
In response to a developing need for specialized data assistance from the Manhattan Borough President’s Office, BetaNYC has created a system to address your research, data, and technical challenges with our team of Civic Innovation Fellows. We produce maps, apps, tools, reports, survey design, letters to agencies, data improvement, and more. The system is called RADAR: Research and Data Assistance Requests.
This report details 20 RADARs and their output. Users include Executive staff of the Manhattan Borough President, Land Use, Community Affairs, policy analysts, and community board liaisons, community board members in Brooklyn and Manhattan, non-profit organizations, Ph.D. candidates, and a city-wide coalition. For each RADAR, you will find a project description, methodology, screenshot of the output, and links when available.
Background:
RADAR is a seminal development of a multi-year partnership between BetaNYC and the Office of the Manhattan Borough President Gale A. Brewer.
Following passage of NYC’s Open Data legislation, we launched the Civic Innovation Fellowship program to help community boards extract meaningful insights from the data. Our first mission was to make 311 data useful to community boards. We developed an open data curriculum, and soon after, BoardStat, a 311 dashboard, – the original RADAR.
“It was remarkable to witness the growing popularity of our service over time, as staff of the Manhattan Borough President and community boards began requesting data assistance for projects previously perceived as out of reach. “
– Emily Goldman, Director of Civic Innovation Fellows
How it works:
What began as drop-bys, phone calls, and emails, we simplified into a web form. A Screendoor survey asks you to articulate your question and need; then our Civic Innovation Fellows respond, collaborate, and address it. The form’s landing page is below.

The form asks the following questions:
- Name:
- Email:
- Best number to reach you:
- Title and Department:
- Please select the most relevant topic(s) of this request:
- Business
- Culture & Recreation
- Education
- Environment
- Health
- Housing & Development
- Public Safety
- Social Services
- Transportation
- Please describe the request and its source. Include the department or person from where the request originated.
- What, specifically, do you want to learn from this request?
- How would you define success for this data assistance request?
- Please note any geographic boundaries of the study:
- Please list any known relevant datasets:
- Please provide any background information or sources of information you think would be useful.
- What is your time frame? Please let us know any specific dates, events, or time constraints you are working with.
Impact:
Please consider the utility of this service for you and your organization. By cracking open open data, we are actualizing its promise: to increase transparency, inform decision-making, empower communities, and ultimately improve conditions on the ground for New Yorkers.
Project Annotation Chart
These are the metadata associated with each project below.
| Annotation | Description |
| Project title | BetaNYC’s name for the project |
| Type | The type of data service produced. Types are:Data Processing Data ScrapingLetter to AgencyData ImprovementData LiberationMeeting CoordinationOpen Data ReportWebMapAppEmbedded MapWebToolPrint Map |
| Data sources | Source or specific datasets noted. |
| Uses | How the requestor originally framed needing/using the assistance. |
| Impact | Retrieved in post-DAR feedback from user; subsequent to use, this field explains what it led to. |
| Contact | Person who submitted request |
| Level | 1-5 denotes technical difficulty levelBasic data and mapping literacy, no coding requiredInvolved data literacy, no coding involvedIntermediate data literacy, APIs, some coding may be requiredAdvanced data literacy, APIs and/or codingExtensive coding required |
| Hours Worked | An approximate number of hours spent on the project using Civic Innovation Fellows or Lab staff |
| Number of Personnel | How many fellows and/or staff worked on the project. |
City-wide
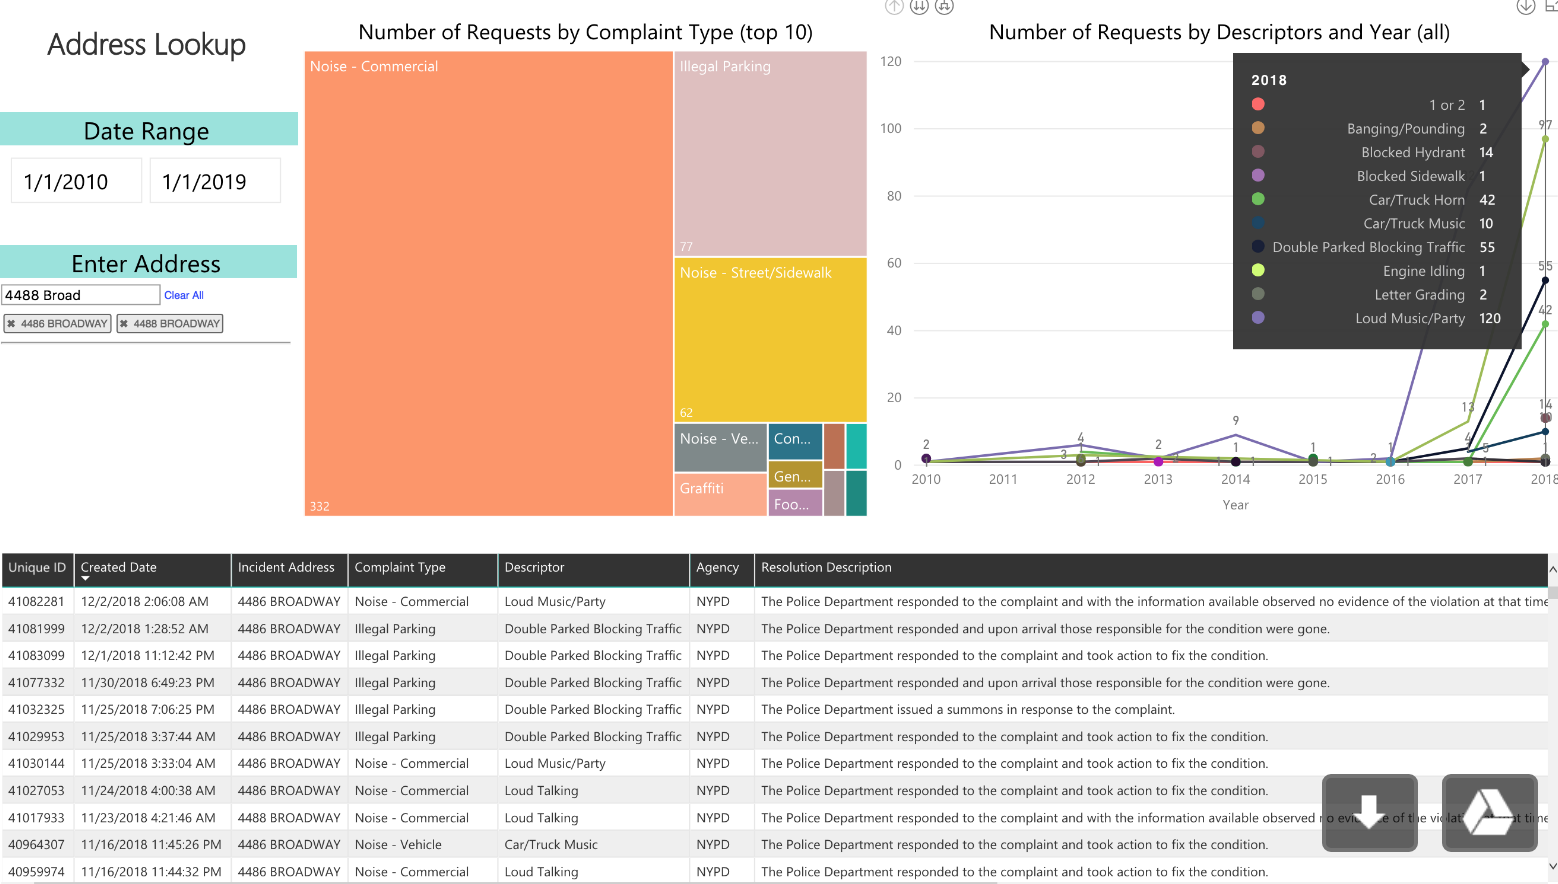
BoardStat
BoardStat is BetaNYC’s first Data Assistance Request, coming from Manhattan Borough President Gale Brewer and Deputy Borough President Aldrin Bonilla. After prototyping in Excel using VBA, we migrated to Power BI and conducted hour-long user-research interviews with District Managers. After building out BoardStat to meet distinct Community Board needs, BetaNYC continues to enhance BoardStat with new features. Version 0.7 can be found on our website.
Project title: BoardStat
Type: Tool/dashboard
Data sources: NYC 311
Uses: For community boards to understand the landscape, history, trajectory of 311 service requests within their districts.
Impact: Informs budget requests in District Statement of Needs; informs district cabinet meetings.
Contact: Manhattan Deputy Borough President
Level: 5
Hours Worked: 120 (and ongoing)
Number of Personnel: 8
Images and Links:

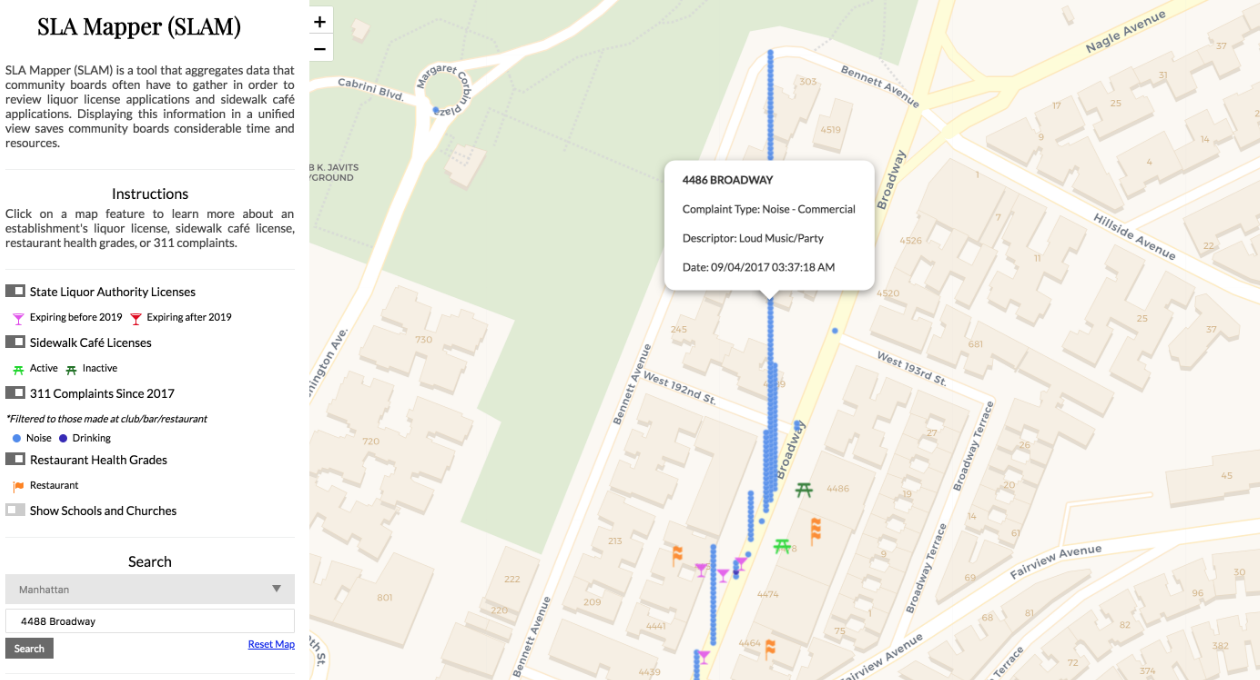
SLAM
SLA Mapper (SLAM) is a tool that aggregates five separate datasets that community boards often have to gather in order to review liquor license applications and sidewalk cafe applications. Displaying this information in a unified view saves community boards considerable time and resources.
Project title: State Liquor Authority Mapper (SLAM)
Type: Tool
Data sources: 311, New York State Liquor Authority, Department of Health and Mental Hygiene, Department of Consumer Affairs, PLUTO
Uses: To help community boards streamline their process evaluating new liquor license applications and applications to renew, by condensing five (5) datasets onto the same map.
Impact: Saves community boards much time in writing data-informed resolutions for SLA applications.
Contact: Manhattan Community Board 12
Level: 5
Hours Worked: 30 (and ongoing)
Number of Personnel: 2
Images and Links:

Boundaries Map
Boundaries Map is a tool displaying ten overlapping administrative boundaries across New York City. One can toggle on and off different layers to see where one administrative boundary intersects with others, and can click a region to learn more about all its intersecting geographies through an info-box on the right hand side. This DAR came from an MBPO CB liaison.
Project title: Boundaries Map
Type: Tool
Data sources: Bytes of the Big Apple, NYC Open Data portal for shapefiles of administrative boundaries
Uses: Helps staff identify the various electeds and agencies covering all corners of New York City. For example, where police precincts or school districts overlay community districts, and which elected officials overlap a given school district.
Impact: Facilitates the work of government staff, especially around contacting the appropriate representatives for any given area in the City.
Contact: MBPO Community Affairs and Budget Department
Level: 5
Hours Worked: 100
Number of Personnel who contributed: 4
Images and Links:

Housing Court Filings Data Liberation Project
Full data on housing court filings is currently not available on the NYC Open Data Platform, only the 10% subset that resulted in evictions. This project involved writing a letter to the OCA requesting the data, and coordinating a meeting at the Office of Court Administration with members of the Housing Data Coalition, BetaNYC, attorneys, influential housing advocates, Manhattan Borough President Gale Brewer, OCA Chief Judge, General Counsel, and other staff to discuss strategies for release. Different levels of the data are available. Level 1 has been released, and BetaNYC is now looking into hosting Level 2 data through an MOU with the OCA.
Project title: Housing Court Filings Data Liberation Project
Type: Letter to Agency
Uses: For tenant advocacy / non-profit organization to target outreach efforts better, conduct deeper research into the eviction phenomenon, and develop policy around unlawful evictions.
Impact: To reduce unlawful evictions. Received press in AMNY.
Contact: Association of Neighborhood Housing and Development / Housing Data Coalition
Level: 1
Hours Worked: 30, ongoing
Number of Personnel: 3
Images and links:

Borough of Manhattan
Tenants Map
TenantsMap shows residential buildings with rent-regulated units throughout Manhattan, and their volume of housing safety-related 311 service requests, which is updated daily. Viewing housing-related 311 service requests (Heat/Hot Water, Paint/Plaster, Plumbing, and Unsanitary Conditions) overlaid on rent-regulated buildings helps community organizations, boards, and elected identify buildings where tenants are at risk of harassment and/or displacement.
Project title: Tenants Map
Type: Tool
Data sources: PLUTO data, NYC 311, Rent Guidelines Board rent-stabilized lists, Department of Finance tax bills data.
Uses: For community boards and tenant advocacy groups to identify rent-stabilized buildings with the largest volume of 311 issues.
Impact: Obviates illegal displacement.
Contact: Manhattan Community Board 7
Level: 5
Hours Worked: 30 (and ongoing)
Number of Personnel: 8
Images and Links:

Project Vulnerable Religious Facilities
The Vulnerable Religious Facilities App displays 394 tax parcels across Manhattan whose building class is defined as a religious facility (church, synagogue, chapel, mosque, convent, mission house etc.), are not protected by historic district designation, and lie within mid to high density zoning areas (R7-2 or higher). Out of Manhattan’s 913 tax parcels classified as religious facilities, 650 lie outside of historic districts and are not individually landmarked.
Project title: Project Vulnerable Religious Facilities
Type: Data processing, map, and app
Data sources: PLUTO data, Landmarks Preservation Commission Historic District shapefile, DOF Rolling Sales Data, Department of Buildings DOB NOW dataset
Uses: For the Land Use team to help them survey faith-based institutions throughout Manhattan
Impact: Starting point for a guidebook for faith-based institutions, and a Religious Facilities Task Force dedicated to this topic. Cited in Crain’s and the New York Times.
Contact: MBPO Land Use
Level: 5
Hours Worked: 30 (and ongoing)
Number of Personnel: 8
Images and Links:

Community Board Membership Map
The Community Board Membership Map displays Manhattan Community Board appointees’ approximate place of residence. The points are randomly shifted to protect the privacy of these individuals. The points are color-coded by members’ Appointment Type: Borough President or City Council. Clickable info boxes for each point show limited personal information also to protect privacy. The map is being used to identify community board member “deserts,” so Community Affairs can select new members from underrepresented areas.
Project title: Community Board Membership Map
Type: Embedded Map in MBPO website
Data sources: Community Districts shapefile, MBPO CB appointment data
Uses: For MBPO to work toward faithful demographic and geographic representation between boards and their districts. Points are randomly shifted to obfuscate members’ addresses.
Impact: Each year these data affect the selection of new CB members.
Contact: MBPO Deputy Borough President
Level: 4
Hours Worked: 36
Number of Personnel: 4
Images and Links:

Community Boards
Manhattan CB 3 Demographic Sector Map
Used American FactFinder, CB 3’s Sector Map, New York County Census Tract shapefile to create new shapefiles for each sector, and then merge them into a sector shapefile. Aggregated demographic and socio-economic data at the tract level into sector and joined with sector shapefile to create choropleth maps on most relevant / frequently asked about variables in CB 3 (including Median HH Income, Median Age, Percent 65+, % in Poverty, % with Disabilities).
Project title: Community Board 3 Demographic Sector Map
Type: Data Processing and WebMap
Data sources: U.S. Census data, Community District shapefile
Uses: To visualize the district’s socio-demographic landscape and update and enhance existing information on their website.
Impact: For CB 3 to justify and strengthen their requests in the Statement of District Needs.
Contact: Community Board District Manager
Level: 5
Hours Worked: 36
Number of Personnel who contributed: 5
Images and Links:

Brooklyn CB 9 Church and School Map
An interactive map showing Religious Facilities and Public Schools in Brooklyn CB 9, at the request of a CB 9 Board member.
Project title: Church and School Map
Type: WebMap
Data sources: NYC Open Data Platform
Uses: To provide transparency of all local schools and churches in an accessible format.
Impact: Increasing awareness and knowledge among community members about local infrastructure and resources.
Contact: Community Board Member
Level: 3
Hours Worked: 28
Number of Personnel who contributed: 3
Images and Links:

Brooklyn CB 9 Businesses Map
An interactive map showing operating businesses in Brooklyn CB 9, at the request of a CB 9 Board member. We used DCA’s Legally Operating Businesses dataset on the NYC Open Data Platform, and combined information with Google Places and Yelp APIs to provide up to date information.
Project title: Businesses Map
Type: WebMap
Data sources: NYC Open Data, Google Places, and Yelp APIs
Uses: To provide transparency of all local businesses in an accessible format.
Impact: Increasing awareness and knowledge among community members about local businesses to contact.
Contact: Community Board Member
Level: 3
Hours Worked: 7
Number of Personnel who contributed: 2
Images and Links:

Office of the Manhattan Borough President
Maps
Grants Map
To help the MBPO analyse its Capital Grant funding and help inform its decisions for FY2021, we worked on creating various dashboards and visualizations of the amount allocated by time, location, and districts. We used various web tools such as Carto, ArcGIS Online, and D3.js.
Project title: MBPO Capital Grants Mapping Project (2014-2018)
Data sources: Annual capital grants data
Uses: For MBPO to analyze the geography of capital grants over time
Impact: To help shape increasingly equitable distribution of capital grants
Contact: MBPO Budget Department Director
Level: 4
Hours Worked: 12 to make initial map; ongoing to add historical data, and add a time slider to map
Number of Personnel: 4
Images and Links:

NoHo Study Area Map
The NoHo Study Area project analyzes parcel and Census data for a precise geographical area in NoHo/SoHo for the Land Use team. We created two spatial data files to align with the study area boundaries. The parcel data enables the aggregation of residential units and total residential area in the study area, and the comparison of these figures between 2002 and 2018. The Census block data enables the aggregation of total population, housing units, number of renters, owners, and more, for the study area.
Project title: NoHo Study Area Project
Type: Data Processing and WebMap
Data sources: PLUTO Data (2002 and 2018) and U.S. Census Data
Uses: To better understand housing conditions in this study area.
Impact: To shape policy around housing in the study area.
Contact: MBPO Land Use
Level: 5
Hours Worked: 16
Number of Personnel who contributed: 2
Images and Links:

New, Narrow Tax Lots Map
At the request of the Land Use team, the map identifies all tax lots that have been created after 2014, and are less than 15’ in width (lot frontage). This required joining 2018 to 2014 PLUTO, and identifying those without a match. Of these 459 parcels, 291 have a lot frontage of 15’ or less.
Project title: New, Small Tax Lot Map
Data sources: Bytes of the Big Apple (2018 and 2014 PLUTO data)
Uses: For Land Use to have informed discussions with DCP about a proposed zoning amendment, involving closing a loophole around “carved out” lots.
Impact: To make sure the proposed amendment takes into account legitimate reasons for creating small lots, and does not pre-emptively rule them out.
Contact: MBPO Land Use
Level: 4
Hours Worked: 48
Number of Personnel who contributed: 4
Images and Links:

Project Schools and Arts Partners
In the process of preparing a database and map of NYC Public Schools and their external arts organization partners, we alerted the DOE of missing data on the ODP. Each school, whatever its total number of arts partners, only listed one. The DOE subsequently improved the data, including “the top four” arts organization partners for each school, rather than only one. Still some schools have between 10 and 20 arts partners, so we gathered hundreds of PDFs into a concise spreadsheet to facilitate scraping the data and getting the full allotment per school. The embedded map below, featuring complete data, is to be hosted on the MBPO website.
Project title: Schools and Arts Partners Project
Type: Data Improvement, Data Scraping, Embedded Map
Data sources: NYC Open Data Platform, scraped data from individual schools reports
Uses: To show which and how many arts organizations partner with NYC public schools.
Impact: To generate policy around equal access to arts organizations among NYC schools.
Contact: Policy Director
Level: 4
Hours Worked: 30
Number of Personnel who contributed: 8

Make Manhattan Mine – Print Maps
Make Manhattan Mine is an age-friendly initiative/event hosted by the MBPO to make the borough a better place to grow old. BetaNYC was tasked with creating large paper maps with various street furniture and transit information for the event. This allows for a reference where participants put improvements or changes to the streetscape on the map. The map was created using Open Data sources from NYCDOT and MTA, and combined/styled in Mapbox Studio.
Project title: Make Manhattan Mine – Print Maps
Type: Print Maps
Data sources: MTA-Transit data; City Benches; Bus Shelters; Mapbox/OpenStreetMap
Uses/Impact: Gather community input on possible improvements to the streetscape.
Contact: MBPO Policy
Level: 3
Hours Worked: 14
Number of Personnel who contributed: 3
Images:


Policy Reports
Noisy Bars – Quality of Life
Used BoardStat and SLAM to investigate a noisy bar in Community Board 12. Created a short Google Doc report with screenshots and links.
Project title: Noisy Bar in CB 12
Type: Data Report
Data sources: BoardStat and SLAM
Uses: To corroborate community concerns about noise issues at this bar.
Impact: May impact a liquor license renewal.
Contact: Community Affairs
Level: 1
Hours Worked: 5
Number of Personnel who contributed: 1
Helicopter Noise
Used BoardStat, the ODP, and other open source research to investigate helicopter noise complaints in Manhattan. Created a Google Doc report. Since the office gets inquiries about helicopter noise regularly, we have updated the report multiple times.
Project title: Helicopter Noise in Manhattan
Type: Data Report
Data sources: The Open Data Platform, BoardStat
Uses: To identify hot spots of where people are concerned about helicopter noise.
Impact: To think through legislation around helicopters.
Contact: Community Affairs, Liaison
Level: 1
Hours Worked: 8
Number of Personnel who contributed: 1

Commercial Noise
Used BoardStat, the ODP, and other open source research to investigate commercial noise complaints in Manhattan Community Board 12. Created a Google Doc report and accompanying Slides.
Project title: CB 12 Noise Analysis
Type: Data Report
Data sources: BoardStat and SLAM
Uses: To help CB 12 investigate its reputation for being the noisiest community district.
Impact: Presented at District Service Cabinet meeting.
Contact: Deputy Borough President
Level: 2
Hours Worked: 16
Number of Personnel who contributed: 2

Ridership Data – 2, 3, Line
Request from the Executive department to provide data on the potential transit impacts of a large proposed housing development near 135th Street/Lenox Avenue. We pulled and processed data from the Open Data Platform and created a Google Doc.
Project title: Ridership Analysis of the 2,3 Line
Type: Data Report
Data sources: Open Data Platform
Uses: To inform a ULURP process on the transportation impact of a large new housing project around 135th Street.
Impact: Equipped the MBPO with its own data at ULURP public meetings.
Contact: Chief of Staff
Level: 3
Hours Worked: 4
Number of Personnel who contributed: 2

Horn Honking Study
Borough President Brewer requested data on horn honking complaints in 311, geographic clusters, how they have changed over time. Data came from the Open Data Platform, and we created a simple Carto map and Google doc highlighting the main findings.
Project title: Horn Honking Study
Type: Data Report
Data sources: Open Data Platform
Uses: To identify clusters of horn honking complaints, and to evaluate whether taking down No Horn Honking signs resulted in more complaints.
Impact: To re-think no horn honking signage and legislation.
Contact: Manhattan Borough President
Level: 3
Hours Worked: 16
Number of Personnel who contributed: 1

Conclusion
Culture change
The research and data assistance requests featured in this document represent the organic growth of the Civic Innovation Fellowship and Lab. One of our earliest theories of change was that being embedded in a government office was integral to culture change; that culture change around technology and data happens gradually by chipping away at intimidation and building trust in the utility and accessibility of these developments.
This system emerged naturally as a way to field, track, and address requests for data assistance from our colleagues in the Manhattan Borough President’s Office and at Community Boards. Gradually, this widened to non-profit organizations, individuals, and coalitions as well.
The emergence of RADAR signifies that culture change is happening; that people are using data and the technologies that support it for 21st century decision-making in hyper local government and beyond.
More concretely, RADAR fills a capacity gap while building literacy.
- Capacity gap – Community Boards and Borough Presidents don’t have enough staff to engage in this type of work. Organizations with limited resources for data crunching and analysis need help leveraging newly-available data to advance their own goals.
- Building literacy – From the general public to students entering the workforce to senior professionals with decades of experience, data literacy infuses policy and legislation-making processes from the ground up. We’ve seen community board appointments become more representative, capital grant distribution more equitable, and religious facilities around the City receive new levels of attention, all thanks to sharper usage of data in local government and beyond.
Metrics of success
We are currently exploring metrics of success for RADAR. As of now, there are the following goals.
- To widen the reach of RADAR, summoning new users from diverse communities in the City and beyond.
- Originally utilized by staff in our physical orbit, our user-base is expanding. We want to serve users from all five boroughs.
- We would also like to see the topical and methodological diversity of requests continue to broaden.
- A second goal is to continue receiving advanced analytical RADARs, demonstrating that people are seeking and generating insights that go beyond rows in a spreadsheet or points on a map.
- A third goal is to see frequent users migrate off of RADAR as they become more comfortable working with data on their own. This has happened to at least one individual in the Office of the Manhattan Borough President, who recounted a proud moment of recognition that she could now address a RADAR on her own. Through a collaborative approach with users, RADAR teaches while it produces.
As the RADAR process matures, we continue to explore metrics of success and its theoretical framework.
Final remarks
In conclusion, this document is a snapshot of where we are in early 2020 with RADAR. It features 20 RADARs from government and non-government partners, and their outputs. Tools, maps, apps, reports, letters to agencies, data scraping, and survey design are among the types of assistance outlined here. Again, please consider using this service for your own needs – it’s light-weight, collaborative, and high-quality, and it helps the Civic Innovation fellows build portfolios and become a new generation of data-savvy, community-engaged leaders.