BetaNYC Associates are doing excellent work in our Civic Innovation Lab! They are helping us respond to more and more RADARs from the community. In this blog post, HaoChe goes into detail about one project he worked on this Fall that supported the Office of Council Member Lincoln Restler’s decision-making process in drafting legislation to address community concerns about film permits.
Read on to learn more about how HaoChe turned the NYC Film Permits Dataset into an interactive spatial analysis tool that supports legislators!
Understanding the Challenge
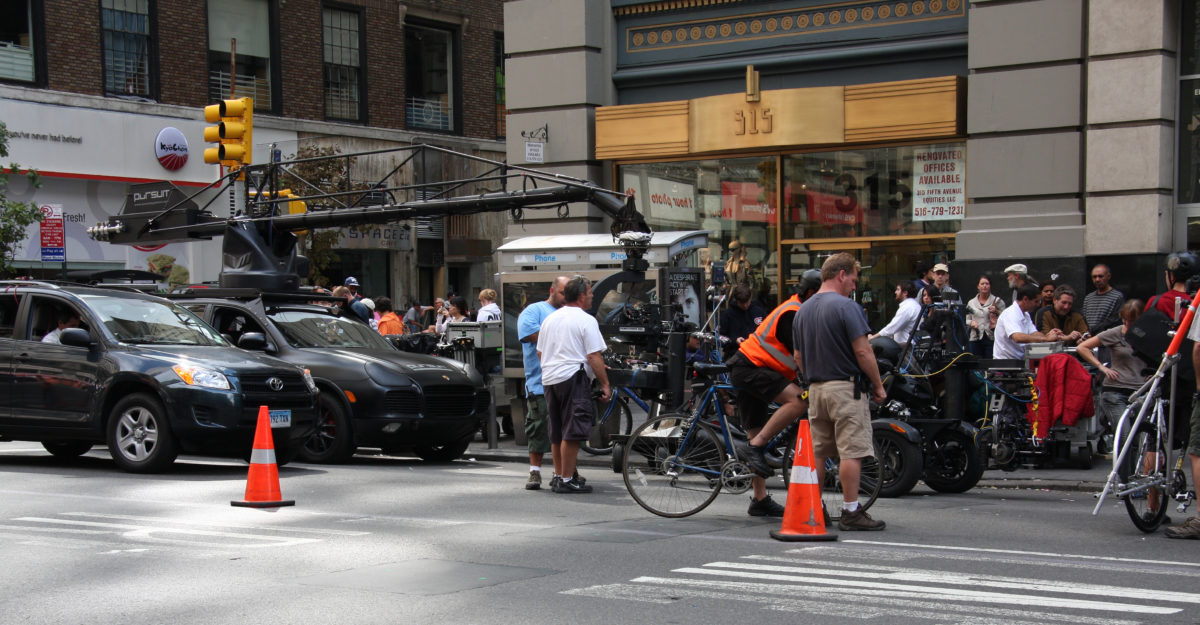
Don’t be surprised if you run into a film set on the streets of North Brooklyn! Based on a preliminary analysis of NYC Open Data, we learned that North Brooklyn has the highest volume of film permits in New York City. While it might sound fun and exciting to regularly bump into a movie set on the street, many neighbors find it a nuisance.
One of the first places we went to better understand the challenge space was the NYC Council Data Team. They already laid some groundwork to measure and track film permit volumes at a citywide scale. We thought we could use this as a basis for a more detailed analysis that would enable a look at film permit volumes within a specific geographic boundary and time frame.
We also took a look at existing legislation about film permits in NYC. We learned that in the past few years, the City Council proposed two bills concerning film permits. The first bill would require film companies to provide residents with 72 hours’ notice when parking will be disrupted due to filming. The second bill would require certain applicants to pay a $800 fee for a film permit, which would expire after 30 days. Both of these bills attempted to address resident complaints that film shoots block local streets, remove residential parking spaces, create detours which lead to traffic congestion, and block access to small businesses.
As observers of the issue, we recognize that the film industry is a significant source of revenue and jobs for NYC and that film shoots are here to stay. But, we also empathize with residents whose lives are disrupted. We wondered: what could be done? Are some residents bearing more of the cost of film shoots than others? How often do film shoots take place in the same street location or vicinity?
Defining the Challenge and Goal
We spoke with people and did some preliminary data analysis to create a list of research questions. By answering them, we could better define what we needed to build. Read on to learn how we answered these questions as part of development process.
Research Questions:
- What geographic area/street experiences the most film permits in North Brooklyn?
- For what duration of time are film permits requested?
- Why do certain geographic areas or locations experience more film shoots than others?
- Does seasonality influence when film permits are requested?
From our conversations, it was clear that while there is a hunch that film shoots are concentrated in certain locations, there is no evidence. We determined that what would be helpful to inform future legislation and community decision-making, would be a tool that community members and decision-makers with little technical knowledge or resources could use to easily view and explore the geographies of film permits in NYC neighborhoods over time. Our ultimate intention is that by making the data more accessible, the issue is more actionable for residents and decision-makers. Perhaps it will inspire more thoughtful discussion and democratic solutions in the future.
Prototyping an Interactive Map
We used arcGIS to prototype an initial interactive map of NYC Film Permits dataset. Mapping is an effective tool for visualizing the distribution of film permits across a geographic space. In our case, it shows us where film permits are distributed across New York City and more importantly, where residents may experience the most streets closures. We built this map so that viewers could determine the number of times that a segment of a street is closed for a film shoot. This visual representation of data can more accurately portray the impact of film permitting in a community than an abstracted aggregated number.

Next, we took the following steps to build out the map:
- Data Preparation: Geocoding
- Data Analysis and Findings
- Cartography drawing with GIS software [/ Final Prototype: Digital Mapping Tool]
Data Preparation: Geocoding
In order to map and analyze NYC Film Permits Dataset (which you can find among many other datasets on NYC Open Data) we first had to prepare the data for geospatial visualization and analysis.
The location data needed for this project is contained in a column called “ParkingHeld”. As it is, it is represented by a street between two bounding cross streets. It does not contain geographic coordinates like longitude, latitude, which are useful for representing data on a map.

Note the column “Parking Held”: the dataset does not provide a good way to search for a specific location.
By geocoding the location data, we transformed address data into useful geographic coordinates so we could conduct spatial analyses.

Different address formats require different types of geocoding techniques.
Types of Addresses and Geocoding Tools
- Exact Address: The most common and straightforward type. When your dataset contains exact street addresses and you want to add longitude and latitude coordinates to your dataset, you can use geocoding tools. Here are two created for New York City street address data.
- Batch Geocoder for NYC is a tool created by BetaNYC that transforms a list of locations into a list of locations with coordinates that you can export. You can review your locations on a map to ensure they are correct before finalizing your export.
- NYC GeoSearch is a service created by NYC Planning Labs that transforms input text—such as an address, or the name of a place—to authoritative New York City addresses using data from the Property Address Directory.
These two types of address formats are more complicated.
- Intersection Address: This address type contains two street names— the first and the second — indicating that the location is at their intersection.
- Street Segment Address: This address type contains the name of a street—the main street— and the name of the cross-streets that bound it— the start street and end street.
To geocode these types of addresses in NYC, we can use either the Location Service API provided by NYC, the Google Geocoding API or the Geocoding feature in ArcGIS. If you are interested in learning more about this, please contact our lab!
For this project, we used street segment geocoding (code line), which most geocoders like Google’s Location Search API do not support. We used the Location Service API to get the line segment ID for each data and we matched the ID with LION Single Line Street Base Map to get the actual line segment.
Data Analysis and Findings
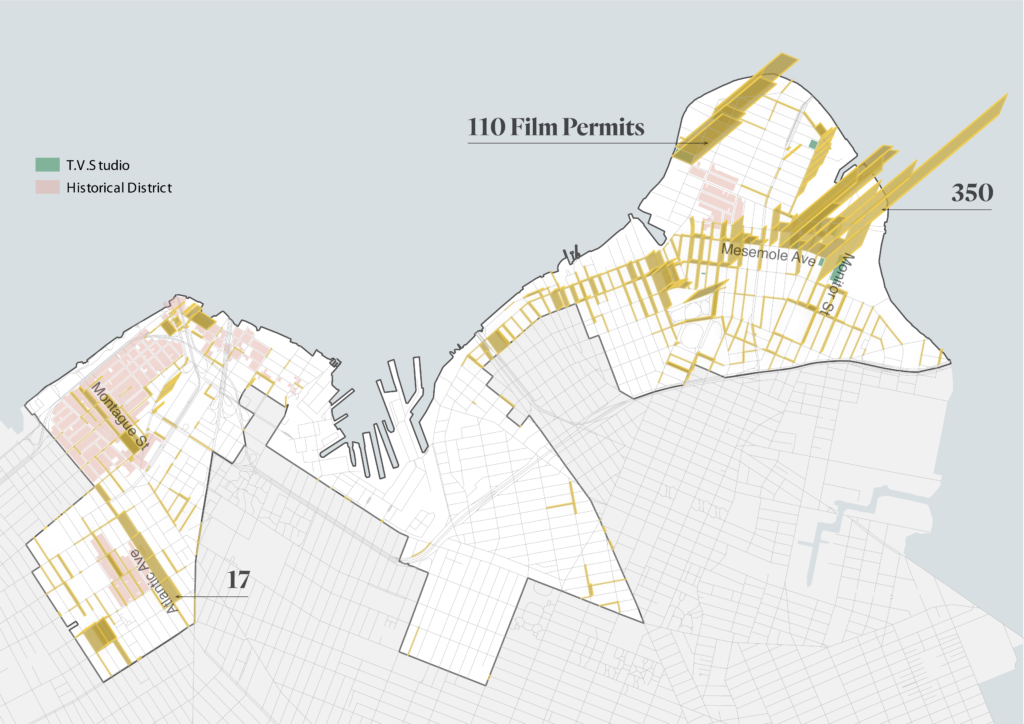
What geographic area/street experiences the most film permits in North Brooklyn?
With the street segment ID, we were able to use the functions “group-by” and “count” to identify which street experiences the highest volume of film permits. In our analysis of film permits in North Brooklyn we found that Monitor Street in Greenpoint experiences the highest volume with 301 film permit requests between [time frame]. Furthermore, we found that the number of requests on Monitor Street and in North Brooklyn in general, was disproportionately larger than the number of film permit requests for other streets and when compared to other streets in other neighborhoods. Of the top twenty streets with the highest volume of film permit requests, thirteen of them were located in North Brooklyn.
For what duration of time are film permits requested? (code line)
Some film permits are requested for a longer duration of time than others. Therefore, it’s difficult to quantify the actual disruption to residents simply by counting the number of requests. So we decided to look into the number of days that film permits were requested for. We did this by calculating “datetime” data from start date/end date to hours and days. The chart below shows that in general, most permits last less than one day. Therefore, it would seem rare for a street to be closed for a really long time. However, we realized that there is nothing stopping a company from taking an additional permit out after one expires.
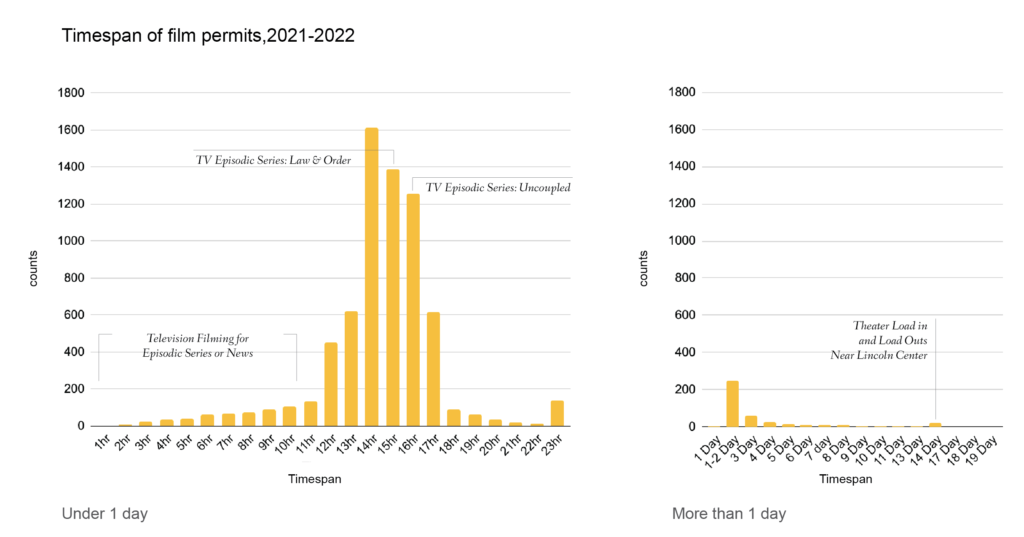
One permit normally takes less than one day to occupy the street.
In further analysis, we aggregated the total time a street is occupied by a film permit. You can view the that code line here.
What geographic unit is ideal for our final prototype? (code line)
In our preliminary analysis, we explored film permit request data by streets, by boroughs, by Council District, and by Community District, and found their boundaries to either be too small (streets) or too big (the others!). We wondered what existing geographic boundary data would be most ideal to use for our final prototype? What is the ideal area size for analysis?
We considered the following:
- If the area is too big, we risk diluting the impact of lots of film permit activity on a street
- If the area is too small, it’s not very helpful for comparison or studying.
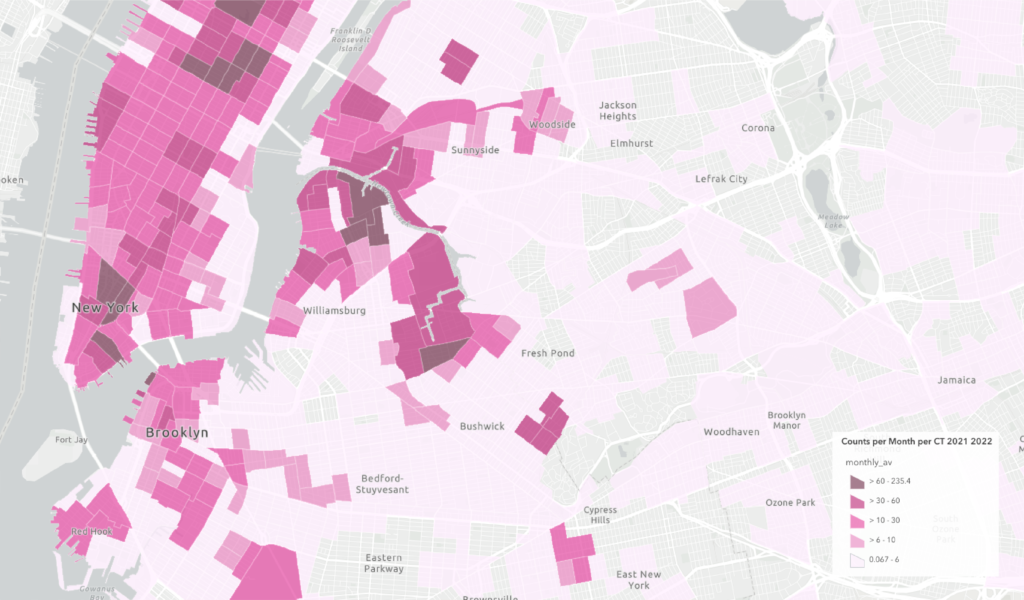
We landed on using census tract boundaries. The area is greater than a block, but smaller than a community district. It’s about the size of a five block radius.
We aggregated the permit numbers into census tracts, and identified which areas have the highest volume of permits.
Besides using counting as an indicator, We also explore the possibility to measure the street blocking time through aggregating the film permit time duration. In order to understand how long do film permits occupy streets per census tract, we aim to create a time duration table of time sum-ups in each census tract. To know how we conduct the analysis, you can see lines in the code.

Why do certain geographic areas or locations experience more film shoots than others? (code line)
After we explored the volume and the timespan of the film permits, we started to wonder why these areas experience a higher number of permit requests. We thought it might be because the streetscape of the neighborhoods are unique, historical or aesthetic, like Wall Street, Dumbo or other landmarked districts. What we found to be the most relevant factor however, was whether film studios were also located there. Streets near film studios tend to have higher numbers of permit requests, and in North Brooklyn there are several. This factor does not explain every high volume street, but does have relatively higher correlation to the permit request numbers.
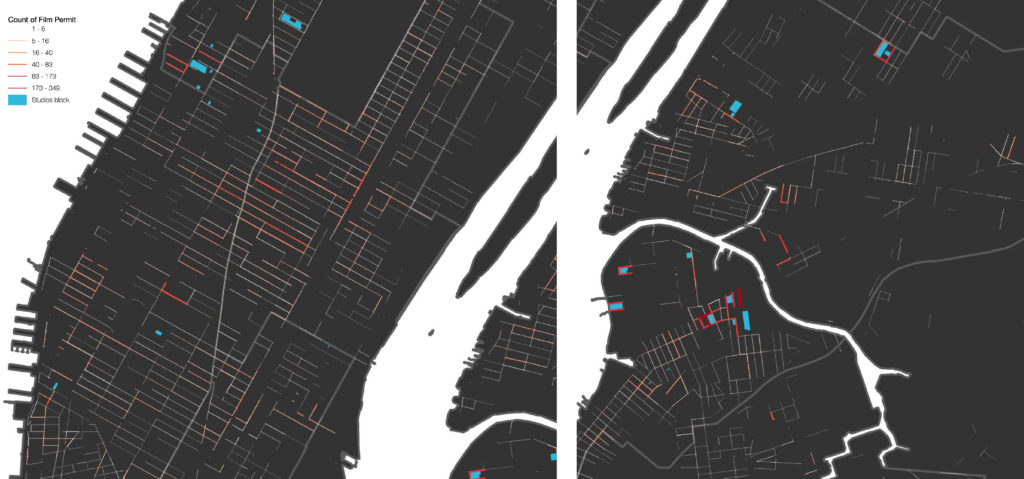
Streets around film studios have a large number of permits. What are they used for?
Does seasonality influence when film permits are requested? (code line)
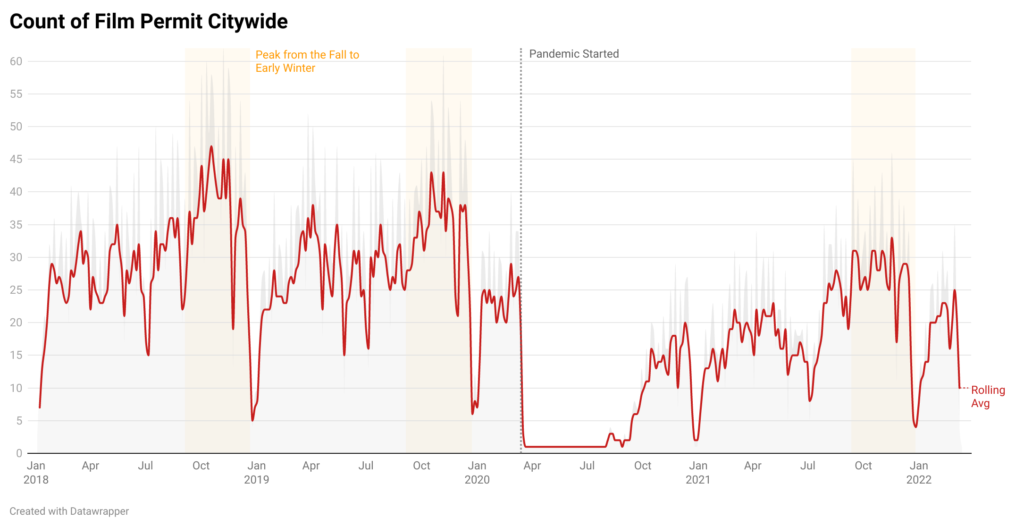
Besides geographical factors, film permit numbers also reflect seasonality. According to our chart below, the peak number of film permit requests occur in Fall and early Winter. Throughout the year, the number of permits are relatively stable, but there is always a drop during the Christmas season. The pandemic also affected the film industry, which you can see in 2020 between April and September. The number of film permit requests has not yet recovered to pre-pandemic levels.
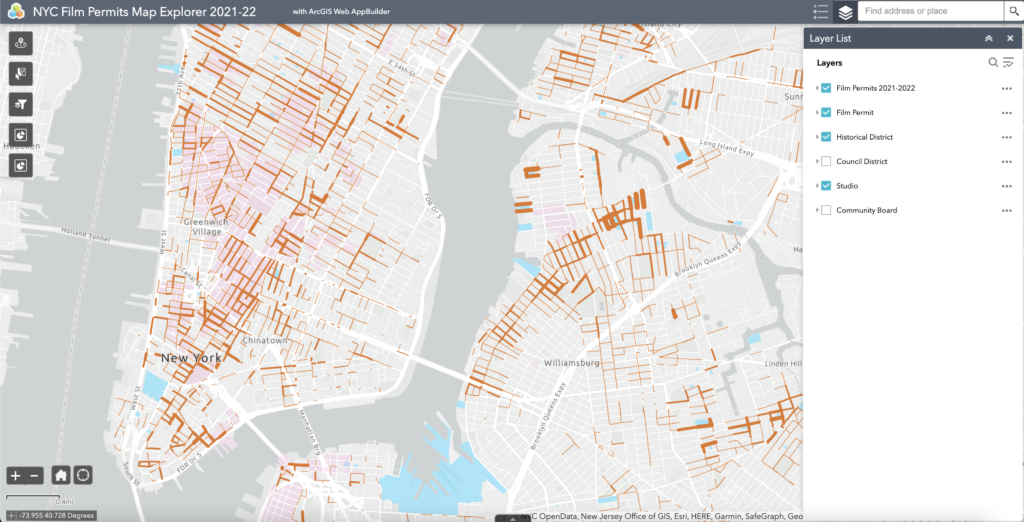
Final Prototype: Digital Mapping Tool
After our research analyses, we wanted to share our findings with the general public and empower others to explore film permit data on their own. We created this digital mapping tool with ArcGIS Online. With the tool, users can search enter addresses and explore the number of film permit requests on streets in their neighborhood. We hope you enjoy using it and will share feedback if you have any!
That’s the end of this RADAR report. We hope this post inspires you and draws your attention to the exciting world of NYC Open Data! All the code we created for this project has already been uploaded to Github (the script for this project). We welcome everyone who is also interested in this topic to explore the scripts. We look forward to learning about your version of film permit analyses and discussing your project details with you!